Due to time concern i am not able to write about nifty intraday movement in last 2 weeks, so here i am posting about nifty’s chart development for 24-7-2013
NIFTY TODAYS CHART READING FOR STUDY PURPOSE
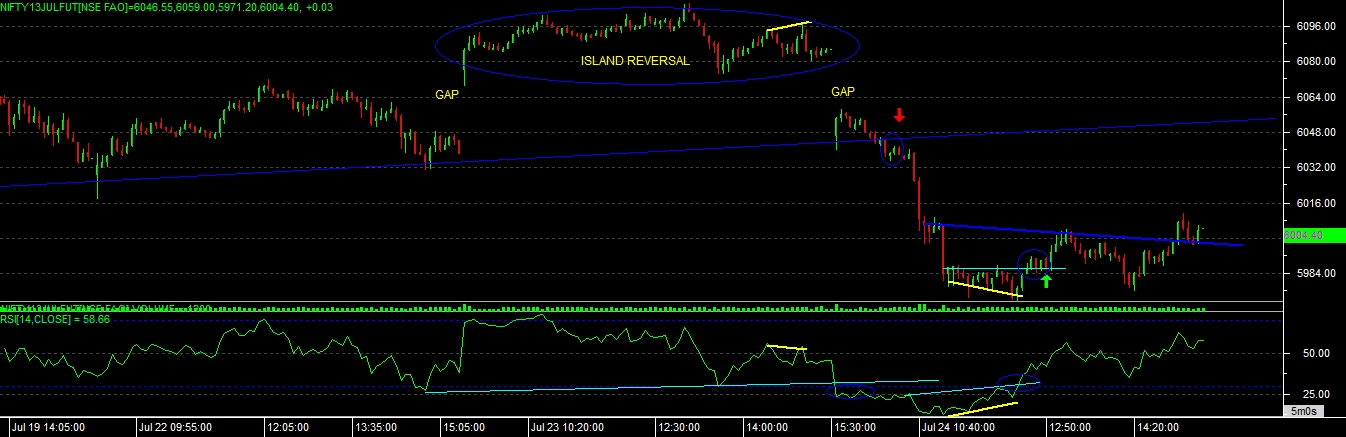
overall chart indicating that nifty has given a signal of ” ISLAND REVERSAL” at open itself, and yesterday ending it has created “BEARISH NEGATIVE DIVERGENCE” signal but not able to confirm the same at end, and it was confirm at todays opening itself. so today there were two pattern on chart which confirm the sell signal in nifty at open, but again there was a support of demanding trendline at 6040 level, so ultimate sell signal was generated below 6040 level without any difficulties, and given a proper move till 6000 and 5970 levels.
After a big fall in opening session, nifty cleanly moved into the oversold zone of RSI {rsi made till 11}, so recovery or consolidation was expect in 2nd half, which was clear on chart, and that time it has given a “BULLISH POSITIVE CONVERGENCE” signal on chart, which was confirm by price crossing above 5990 level, but after this also nifty not able to do much movement for the day so last session was of BULLISH AND CONSOLIDATING.
So overall market given a good movement today, which was very clear with technical study also.
NIFTY VIEW FOR 25-7-2013 EXPIRY DAY
overall at end nifty able to give some reverse up movement today at end and able to give close above resistance levels for the day, and even not able to give any selling signal at end.
so overall gap up opening we can assume for tomorrows session, after a open if nifty able to sustain its gains for 15-20 min. then upside we can see resistance levels at 6025-6055 and down side support levels are 5980-5965.
if able to sustain after a open then market is having a good change to till resistance levels upside as RSI is still not moved to the over bought zone yet and still there is no signal of convergence or divergence yet on chart.
so on expiry day we are considering market range between 6055-5965 range, and if market able to move beyond this levels and sustain for 30-45 min then this may decide a trend of market and which can be consider as a short term trend of market.