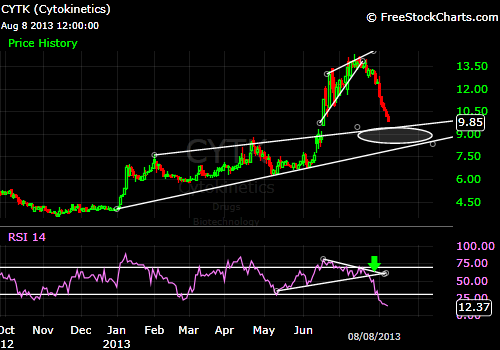
Interesting to see this chart, just see, stock has given a breakout in RISING WEDGE PATTERN and done movement from 9.50 to 14.25 almost,.
after the sharp rise in price, it has crated rising wedge pattern on chart supported by fall in RSI, which clearly indicated the NEGATIVE DIVERGENCE, and after a breaking the wedge as well as SYMMETRIC TRIANGLE on RSI stock given a sharp fall to which look like inverted “V” shape on chart,.
now stock has moved in highly oversold zone in RSI and price is still falling, as per the chart we can still see that price can try to fill up the gap at 9 and after that immediate having a long term support line at 7.
so till we see red bar on chart, investor can still wait till it get the support at desire level, and once it able to move from support level and if able to give 2 days positive close from support then we surly can see up move in stock with steady and consolidated up move.
so overall study indiacte that till the price is falling stay away from it it might give some long term breakout also towards downside, but if able to move above from support for 2 days can give some indication of reversal in price and give stop to its falling movement.