positional view in DOWJONES {spot} – BUY NEAR SUPPORT IN A RANGE OF 15400-15450 WITH 15380 AS STOP LOSS, upside 15700-750 looking resistance and breakout will be above this range only
if dow jones able to close or break below 15380 then sell below this level with recent top as stop loss and down side it can give targets till 14850-14550-14350
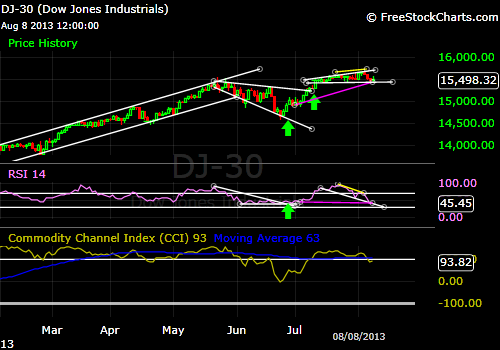
Have a look at the DOWJONES chart, one of the world’s strongest economy, and same is represented on this chart.
on chart we can see that price is raised continuously in past 5-6 month, we must say its a sharp and steady really from the index, but is it due for correction now, or we can see more rising is coming days, look at the chart reading now.
on that we can see that before a recent breakout in price it has given a DESCENDING INVERTED WEDGE PATTERN ON CHART, and its a broadening pattern, as time increase price gives more wild moves with bigger opportunities to trade on support and resistance levels.
on the same time if we consider RSI, then just see RSI has given a descending triangle pattern on chart and when it given a upside breakout in this pattern, same time price also started to move up from its support level, and thus it confirm the short term trend reversal here and given a buy signal.
another thing to notice is, it has also given a BULLISH CONVERGENCE SIGNAL on chart with the falling bottom on price chart and rising lows in RSI, so at this breakout there are more more confirmation at buy side and according to all signal’s price also given a decent and biggest breakout again.
now coming to the recent development, we can see that, its in a formation of BROADENING ASCENDING CHART PATTERN WITH RIGHT ANGLED, with the broadening characteristics.
and at the same time RSI has given a NEGATIVE DIVERGENCE SIGNAL on chart, as we can see that recently price able to make the new tops but same thing not work out for RSI that time.
now the key of this pattern is PARTIAL RISE AND BREAKING THE TREND-LINE DOWN SIDE, then only it can give proper selling signal and if able to move upside and if able to break upper trend line then we can see some upside breakout move.
Another thing to look up is, if you see the pink line on price chart and RSI then possible we can assume that its a BULLISH DIVERGENCE on chart but yet not confirm.