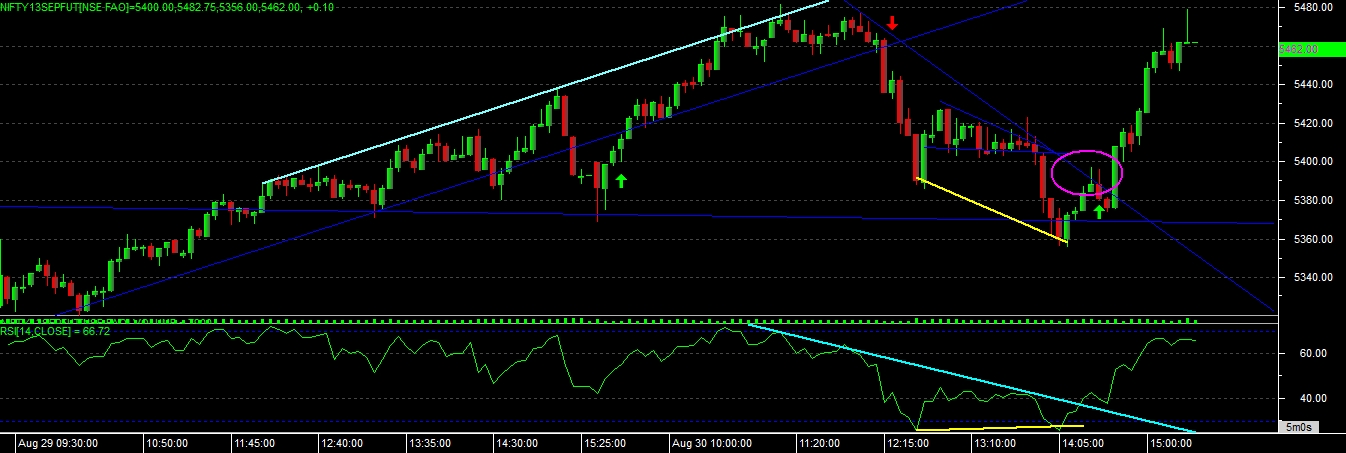
As we can see todays intraday chart of nifty, we can cleanly identify that it was moving in up-warding channel from yesterday itself, after a morning panic it has given a reversal buy signal with again entrance in channel, which we can clearly spot on the chart. where we given a morning buy at 5440 level and even given book at 5480 level.
again after touching the upper trend line nifty has slowdown its movement, so we waited again till it break the downside support level, where it has made 5433 low and there we given a sell signal in nifty, and it sharply fallen down and made 5385 level, after taken support there it has made a small descending triangle on chart and with that triangle it has given a breakdown at 5400 level it has a width of 30-35 points so after a this break it has given a fall till 5356 level which is almost a 40-45 points there we given full book 5360-65 range.
now all must be thinking about how market suddenly reverse from this bottom, so here is the answer, on chart we can see that there is a formation of descending triangle on chart, so market taken exact support over there, now after a support we again looked for any reversal finding, and there we got RSI POSITIVE CONVERGENCE signal on chart, which hinted us a early reversal at bottom, but more confirmation was given, when RSI able to move above resistance level, shown in chart, and price also moved in same direction, price has broken the resistance level of triangle, there we given a 3rd call for the day buy at 5375 and it given almost 100 points sharp move, because whenever is a reversal signal in any trend it should move fast, then only its count as a proper reversal.
above chart and reading is posted for study purpose, and all live calls also posted on our website as well as facebook id – NITIN STOCK.