OUT OF A 1000 POINTS MOVE ALMOST 350-400 POINTS FROM GAP UP ONLY – IS IT A REAL UP MOVE OR EXIT RALLY FOR INSIDERS???? STILL BIG QUESTION MARK.
THIS IS FOURTH TIME MARKET VERY NEAR TO THE LIFE TIME HIGH – IS IT A BIG GAME PLAY OR WE CAN EXPECT A REAL LONG TERM BREAKOUT ??
ARE OUR ECONOMY IS THAT MUCH STRONG TO ABLE TO MAKE THIS BREAKOUT NOW ???– SEE WHAT TECHNICAL CHARTS SAY’S ABOUT MARKET
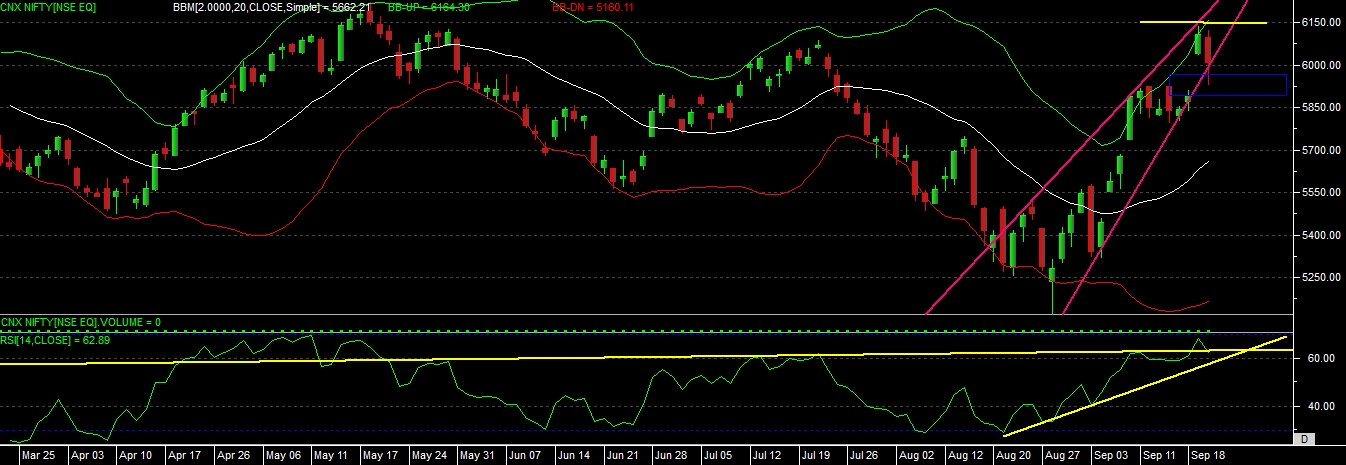
Overall chart pattern and condition indicate that upside resistance level is 6150 close beyond this level only can give more up move in market, downside support are 5900-5750-5650 levels.
next week it’s very important which side market cross the level and that will decide the upcoming trend, upside biggest resistance is 6150 if close above this then we can see 6250-6400-6600 level, moving below 5900 and closing below this will confirm a time-being downfall in market which can lead for a movement till support level of 5750-5650-5500 levels.
So trend lovers keep eye on 5900 and 6150 levels in mind do intraday trading near this level and if market able to close beyond this levels then only carry position as per the direction.
In a last week study we asked that is it a 2nd breakout in market and just see what happen, we clearly told that till market not close below 5800-5770 level don’t look for selling and just see it not able to close below this range made 5798 and given a sharp bounce from there after a 3 days of consolidation as we mention in our report about consolidation before move, for bulls we inform to collect at this level because 2nd breakout was above 5950 level and it done with gap up and this is the reason we inform to collect at support, and this move able to give nifty 6150 level in last week.
As per the current chart study of nifty we can see that nifty has given higher level moves at top level with a decent growth in volume in last half month, so this is the normal indication, that rally started with volume and still at the top level volumes are good if we compare to the previous volume so this can indicate us that, traders are still interested at upper level but what will the next direction?? We don’t need to decide that, market levels will decide the next directions.
As per the technical chart we can see that nifty is clearly trading above its 100 and 200 moving average levels, which is still indicate that market above move above strong resistance level, but is this gains will be sustain in coming days, that we can decide with our technical levels only.
As per the candlestick chart pattern we can see that it has given a “bearish tweezers tops” which are normally found when market try to reverse its trend, but still confirmation of this is must for any assumption.
Another candlestick pattern we can observe is “piercing pattern” at top level, or we can say it’s a “bearish engulfing” candlestick pattern.