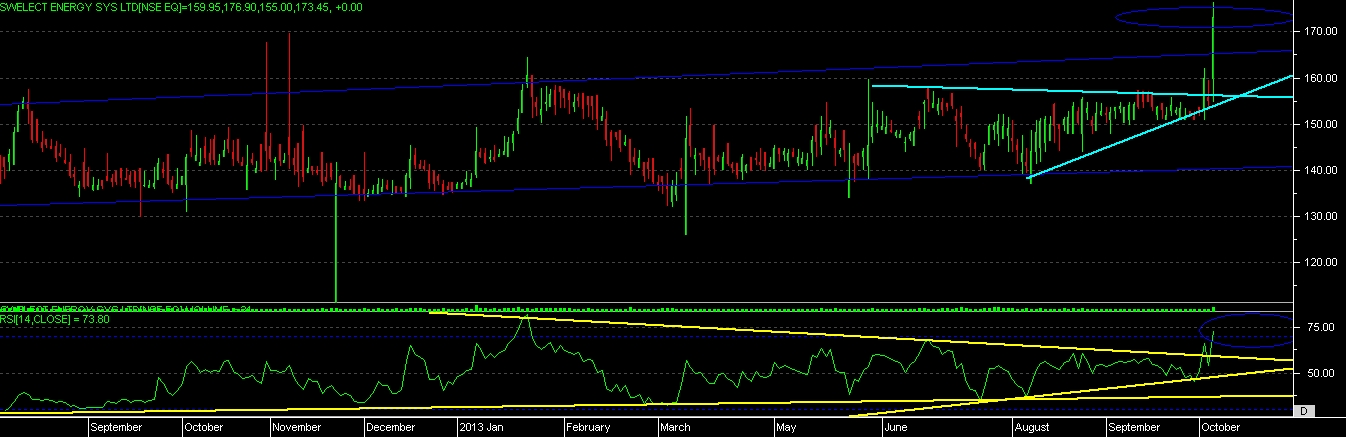
Swelect energy – we can see that stock has able to move above its long term resistance trend line and given a positive close above trendline on 7th oct. 2013, so this is the clear indication of momentum started in this stock.
if stock is able to give close above 177 level then hold delivery in this stock with 145 as sl on closing basis targets are 220-250
technical chart view –
as per the technical chart we can see that stock is moving above its resistance level now, so one more positive close above current high will give confirmation of coming up move.
after trading into trend line channel for past one year stock able to move beyond the trend line today, so its very important to see what next move it can give.
stock has also broken the ASCENDING TRIANGLE recently and able to give breakout today {we covered its intrday move from 170 to 177 level}
RSI also moved above its resistance level now, and has also took support previously on its supporting trend-line, price has pulling the RSI into the overbought zone now, so more price action can give more movement in oversold zone for RSI.
so as a long term chart suggested we can surly buy this stock if it able to confirm it breakout by giving the desire close, and its also seems like stock is changing its long term trend now, so if able to confirm its long term buy signal, then buying on deeps and selling on high’s can give good returns for trading purpose also.