Buy DBREALITY above 62.5 sl 56 target 70-75 {1-5 session}
technical reading –
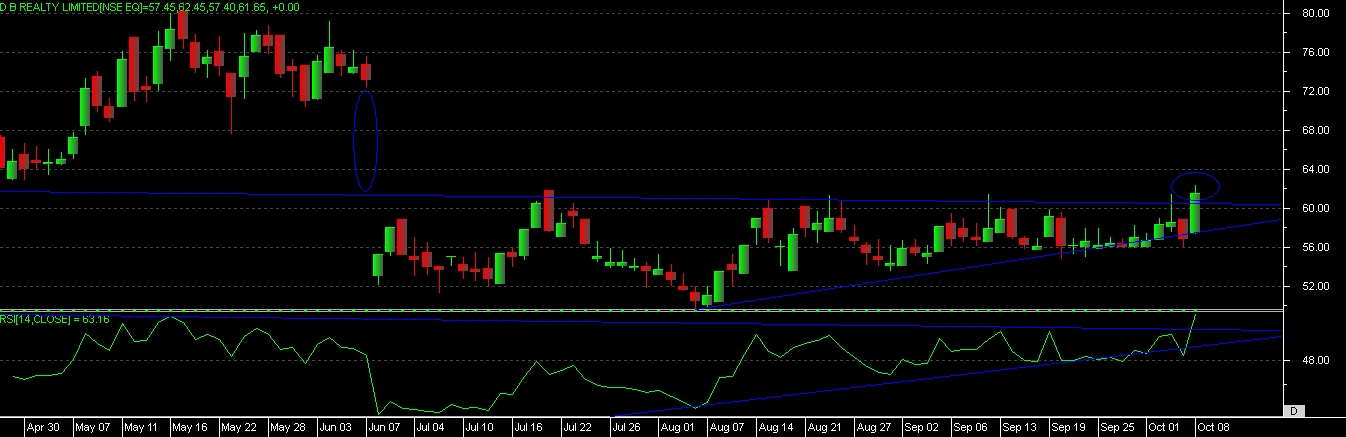
if we look at the chart of stock, we can clearly see that price able to move above its “ASCENDING TRIANGLE” chart pattern, and this triangle having width of rs. 10-12, so above 62.5 we can expect a movement of rs. 10-12 in this stock.
another thing we can notice is stock has given a gap on chart in a month of June from 73 to 55 level, so after a breakout level stock can try to fill this gap.
as per the candlestick pattern stock has given a “BULLISH BELT HOLD” candle in last session, which means moving above our level will produce some good results in price.
recent development in RSI shows us that RSI able to move above its long term resistance level on chart and has taken a number of times support on its rising demand line at bottom, presently rsi is at level of 63 level, so after a price breakout, price can drag the rsi in overbought zone and thus we can see action on chart..