Last week we clearly mention that market having a good support in a range of 6000-6100 and see market bounce from 6079 level, and made till 6335 almost.
As per the current chart development we can see that, nifty still move upper level and made 52 week high last week.
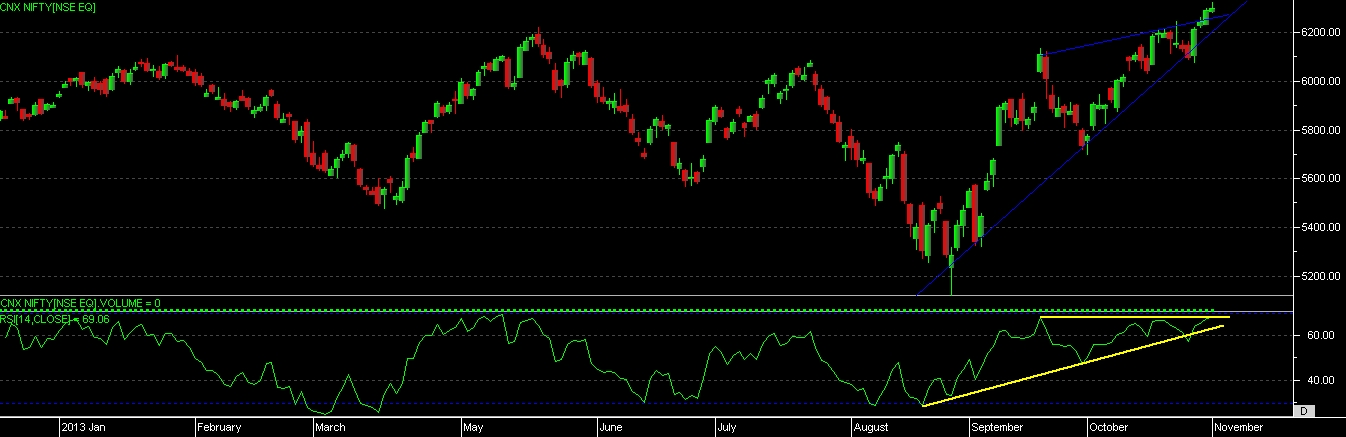
As per technical we can clearly see that RSI is making “ASCENDING TRIANGLE” on chart and nifty is making “RISING WEDGE” pattern on chart, it’s a clear indication of “DIVERGENCE” on chart.
As per the candlestick pattern we can see that nifty has given “SHOOTING STAR” candle on chart, which always indication of reversal but till we not get any confirmation, we can’t react on this pattern.
Last week we seen that nifty given “”WHITE CLOSING MARUBOZU” on Monday and then “WHITE OPENING MARUBOZU” on Thursday. Both this pattern indicates that market still holding the buying signal at upper levels.
As per current chart development we still cant avoid the upper movement in our market, as RSI sill not moved in over bought zone yet, so now market having a support at 6200 level, and if able to give close below this level for 2 session then only we can expect some trend reversal or correction in market.
Upper side 6350 seems to be good resistance now, closing beyond this level can give 6450-6550 levels in market, below 6200 support we can expect 6080-5950-5800 levels.