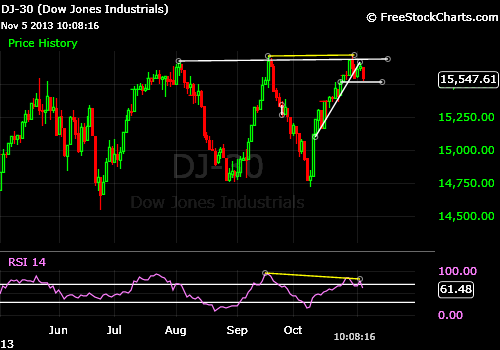
recently we given call in dowjones to buy at 14850 level with 15700 as our sl, and it able to give new high on chart, made 15721 level.
now with current chart development, we can see that price is facing the trend line resistance now, and even after new high price not able to sustain, so this is a sign of reversal in trend or we can say profit booking at higher levels.
as per the candlestick pattern’s we can see that when it made new top that time it has given a “DARK CLOUD COVER” candlestick pattern, and this was the indication of reversal at top.
another thing we can notice is it has given a “NEGATIVE DIVERGENCE” signal on chart as price has given the new top but RSI not able to give new top.
so overall chart study indicate that now, if dow jones able to give close below 15500 level for 2 trading session then go positional sell side with 15750 sl for target of 14800-14300 level.
but if it try to cross upper levels then buy and hold only if it move above 15750 and able to give 2 close above this level, then only carry positional buy, but before 15750 level dont think for any buy for holding purpose.