Well we are not market trend decider, we are just trend follower.
Correction, fall, down trend, uptrend, reversal, and breakout are the different names of the market trend only, and our work is to follow them with proper level, taking positions near support and resistance and holding it till get any reversal signal will ultimately make you a trend follower.
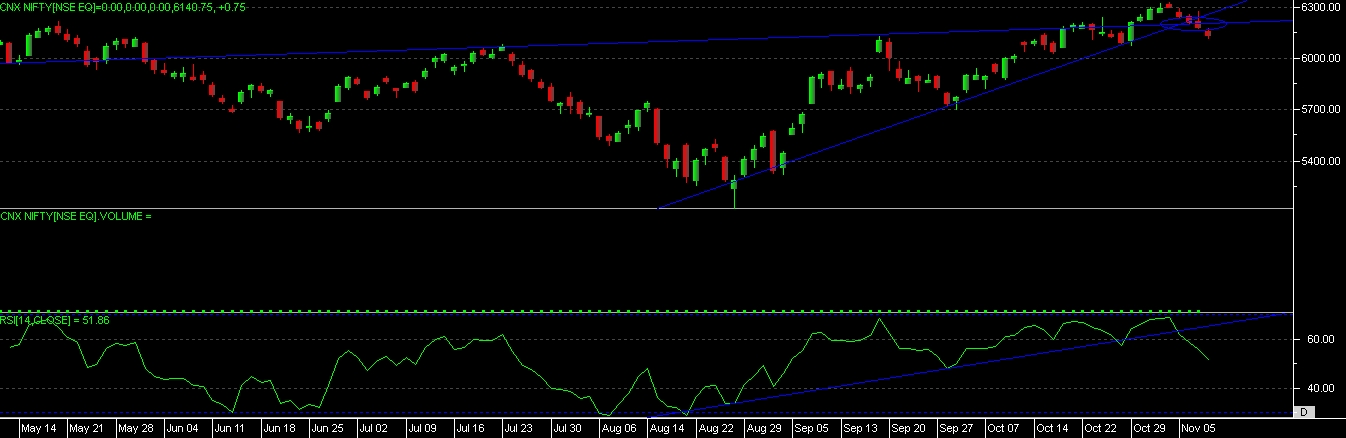
Last week we clearly mention that 6350 looking good resistance in nifty and just see market return from 6343 level, we given down side support of 6200 level and nifty able to made till 6120 level.
As per current nifty chart development we can clearly see that market is moved below supporting trendline now.
Another thing to notice is this is the first incidence after rally that market has given FIVE continuous red bar’s on chart, even same thing was happened after 23rd july 2013 market given FIVE negative session after making a top of 6100 almost, and from that point it lead for almost 1000 point fall.
RSI also indicating the falling move in market, and its moved below support line now.
Look at some candlestick patterns it has created last week.
It has created “EVENING STAR” candlestick chart pattern at top or its almost similar to “ISLAND REVERSAL” pattern at top.
On Thursday, market has given “SHOOTING STAR” candle on chart, and same was confirm on Friday by one more red candle on chart.
Now overall above mention pattern and indicators given some weakness sign in market now.
As per the chart now we can see support at 6070 level now, {as market has given a fall already from 6340 to 6120 level, so now we are providing fresh levels for next movement} so if nifty able to close below 6070 level now then down side we can see levels till 5900-5700-5500 also, if market close below 6070 now then “EVERY BOUNCE WILL LEAD FOR SELLING PRESSURE”.
If market takes support at 6070 level now then upside we can see 6235-6285-6350
So now concentration on 6070 level on closing basis, closing below this level can bring weakness in market, taking support near to this level and giving green bar on chart can give some reversal movement also.