Last week we clearly mention that market is moved below support trend line now, also mention that RSI showing falling movement and its below support level.
Last week we mention three candlestick patterns, “EVENING STAR”, “ISLAND REVERSAL” AND “SHOOTING STAR” and all this mention patterns are known for top reversal, and see market given a good fall in last week excluding last trading session.
Now at present market is trading on very crucial levels, last session positive close given some hopes to bull traders.
At present there are two major technical chart developments, one is for bullish breakout and another one is for bearishness, we will discuss all this patterns in today’s article.
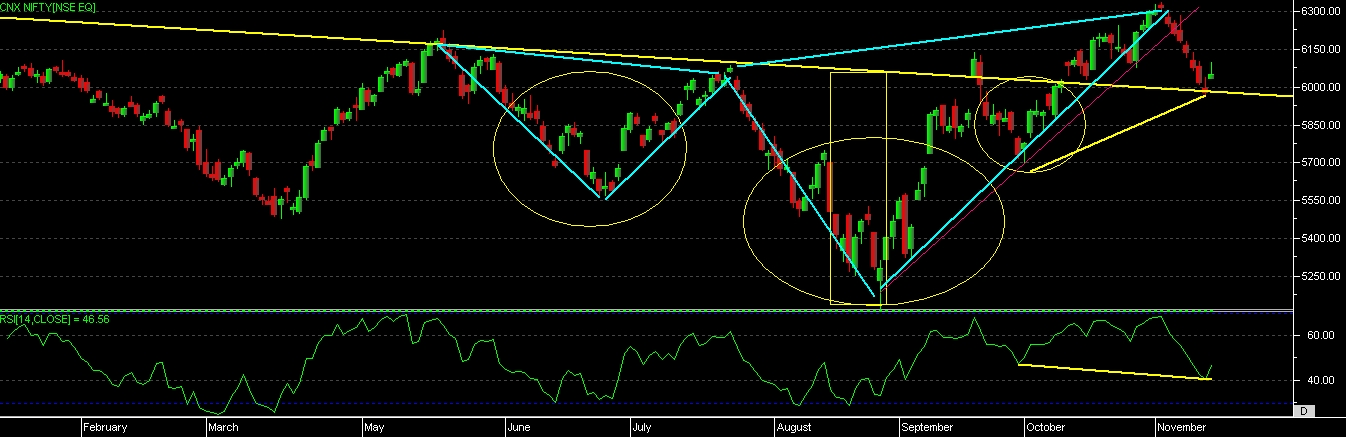
- As per the current chart development we can see that there is a development of “BUTTERFLY BEARISH PATTERN” on chart, {shown with sky blue lines on chart}.
As we can notice that market able to make new life time high recently, but at the same time RSI not able to move to the upper range, it clearly indicates that there is development of “NEGATIVE DIVERGENCE” on chart with the appearance of BUTTERFLY pattern, so this pattern given us a bearish signal as per development.
- As per another view we can see it’s a development of “INVERTED HEAD AND SHOULDER” pattern on chart, which is shown with yellow lines on chart, we can clearly see development of two shoulders and one head which is shown in yellow circle, as per the pattern market able to cross the neckline, but again it came down and taken support exactly on neck line, so this pattern give us some hint for bullishness in a market.
As per the candlestick patterns we can see that currently market has developed “MORNING STAR” candle on neckline, which give some indication of support at current levels, but pattern can confirm if market able to cross the high level of this pattern.
So overall indication at present level is if market able to give close above 6120 level in coming session then further resistance levels are 6200-6265-6350.
If market able to close below 5950 level in coming days then only more bearishness we can see on coming days, because there it will give more confirmation to “BUTTERFLY” pattern, and inverted HNS pattern will be invalid if close below 5950 levels for 2 trading session.
So with this two major patterns on chart we can suggest that more positional sell can be taken below 5950 level only below this level we can expect 5700-5500-5200 can come or can wait till more upper level to come with reversal signal, at present market taken support with above mention pattern, so for time being we can stay bullish in market with current levels, but if any how market able to go and close above 6400 level for 2 session then we can see more upside in a market till 6700-7000 levels also.
For coming week 5950 level is very crucial support now, and upper side 6250 looking good resistance.