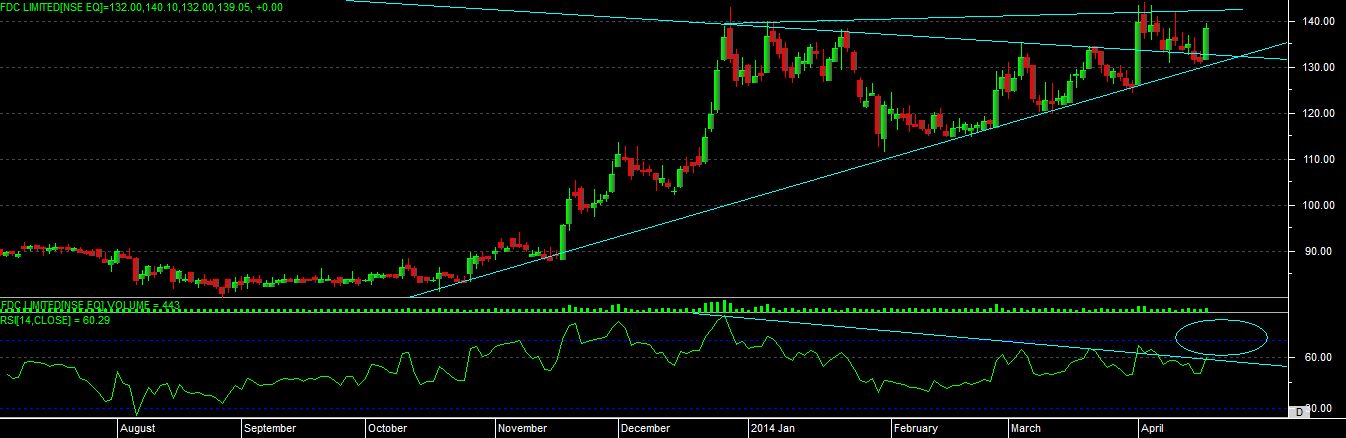
buy FDCLTD above 145 close sl 124 target 175-197-215 even more also.
technical chart study
as per technical chart development we can see that, stock has taken support on rising trendline, its also a “SYMMETRIC TRIANGLE” on chart with target range of 35-40 rs.
there is also a development of “BULLISH NEGATIVE DIVERGENCE” as rsi still having scope for up move on chart, so price movement with given levels and bring some good up move in this stock.
so overall basic study indicate that price movement above mention level on closing basis with proper support level can bring some good move in stock.