buy ASAHISONG above 120 sl 95 target 170-225-270
technical chart study
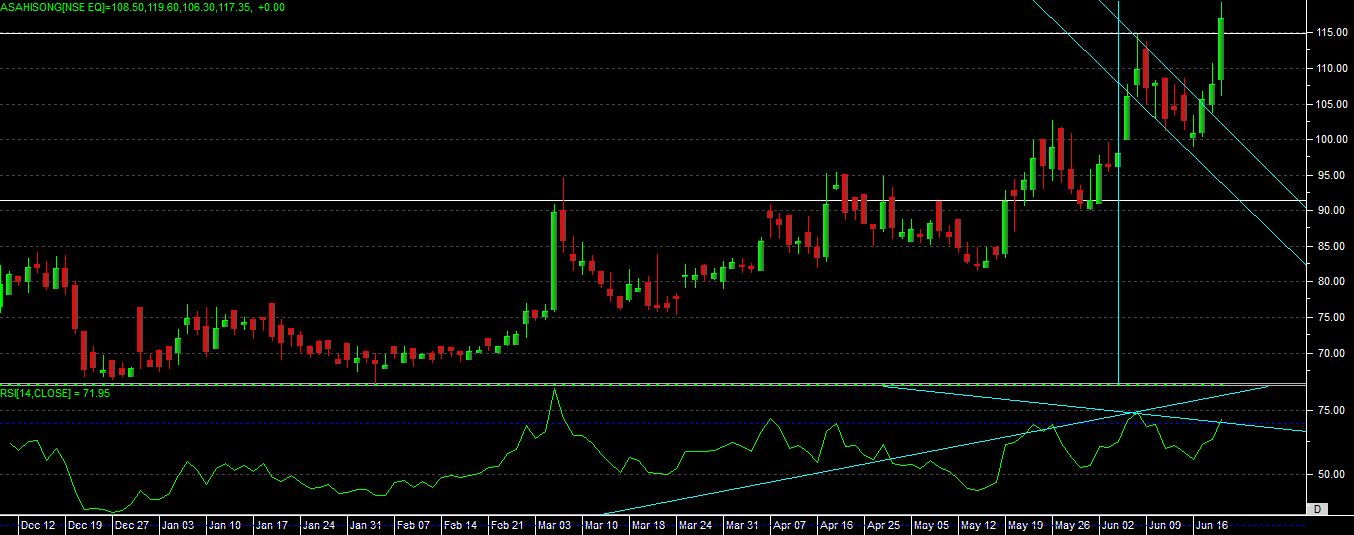
as per the technical chart development we can see that stock is trading on its life time high now, recently it broken its lifetime high of around 110 and made top of 115 and in todays session again it has broken this top, so overall stock is showing bullishness on chart.
as per the recent chart we can see that it has made “FLAG” pattern on chart and above to move above the resistance level in todays session.
its rsi just touch the overbought zone, but no need to worry till the time price sustains, again it has given a signal of “NEGATIVE BULLISH DIVERGENCE” at upper level.
so overall study indicate that if stock is able to confirm the given level and able to close above that level then we can expect a good up move in stock in coming months.