Buy TCS above 2545 sl 2520 target 2585-2625
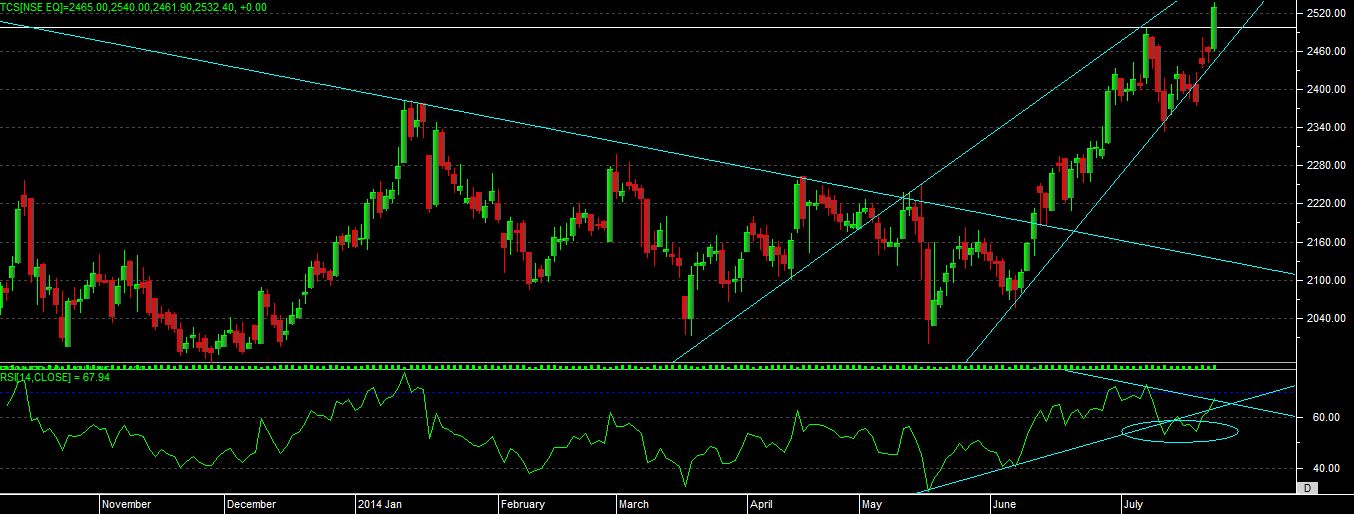
technical chart study
as per the chart development we can see that, stock is moving in to “RISING WEDGE” channel, and even it able to make new life time high level in last trading session.
in last session it has given a ” STRONG BULLISH BELT HOLD” candle on chart, and rsi still having a scope for up move, as of now rsi has developed “BULLISH NEGATIVE CONVERGENCE” on chart now.
so once if stock able to move above mention level and able to sustain for 15-30 min then we can expect a good up move for a coming week.
please not stock need to cross and sustain above mention level for atleast 15–20 min then only we can assume that call will be active.