delivery buy BPCL in a range of 650-685 sl 520 target 850-1050-1250
holding period 1-2 years
technical chart study
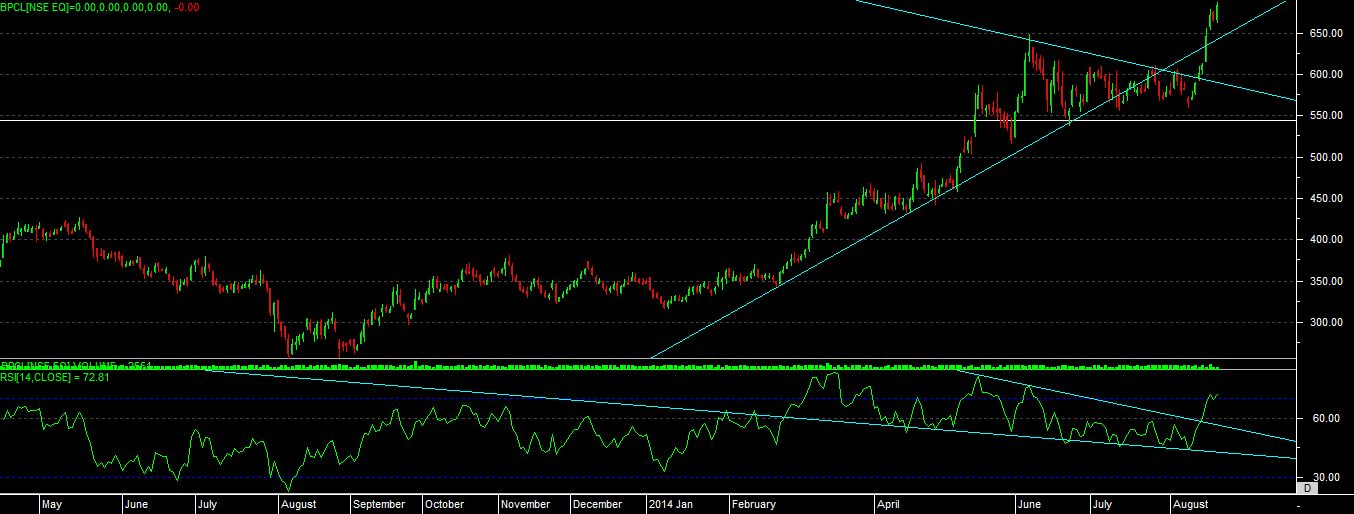
as per the chart development we can see that stock is trading at life time high level which clearly shows that stock is outperforming on charts.
even we can see that its taking support from rising trend line with the extended trendline and able to make new high recently.
it has even given a breakout of “SYMMETRIC TRIANGLE” on chart.
even with rsi its showing ” BULLISH NEGATIVE DIVERGENCE” which is the indication of strongness.
so overall one can buy this stock in given range and wait with support level for inform time period, dont expect a quick or fast move in stock.