“Opportunity follows struggle. It follows effort. It follows hard work. It doesn’t come before”
Implement all this in your trading and you feel trading as opportunity.
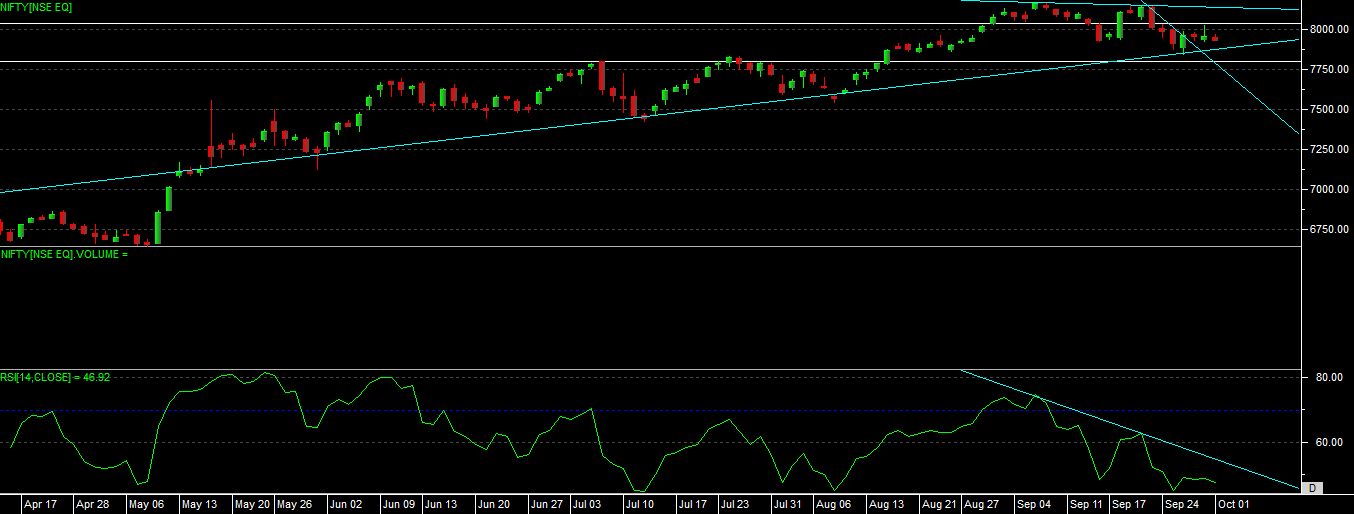
As we are informing from past two week that market has made lower top, lower bottom formation to till its below 8160-70 range one has to sell on every rally to get the opportunity of this fall and its same happening on chart now, we seen fall till 7920 last week.
Now if we see nifty chart now, on daily chart its giving a correction as of now and major correction we can expect only if nifty able to close below 7800-7840 levels in coming days.
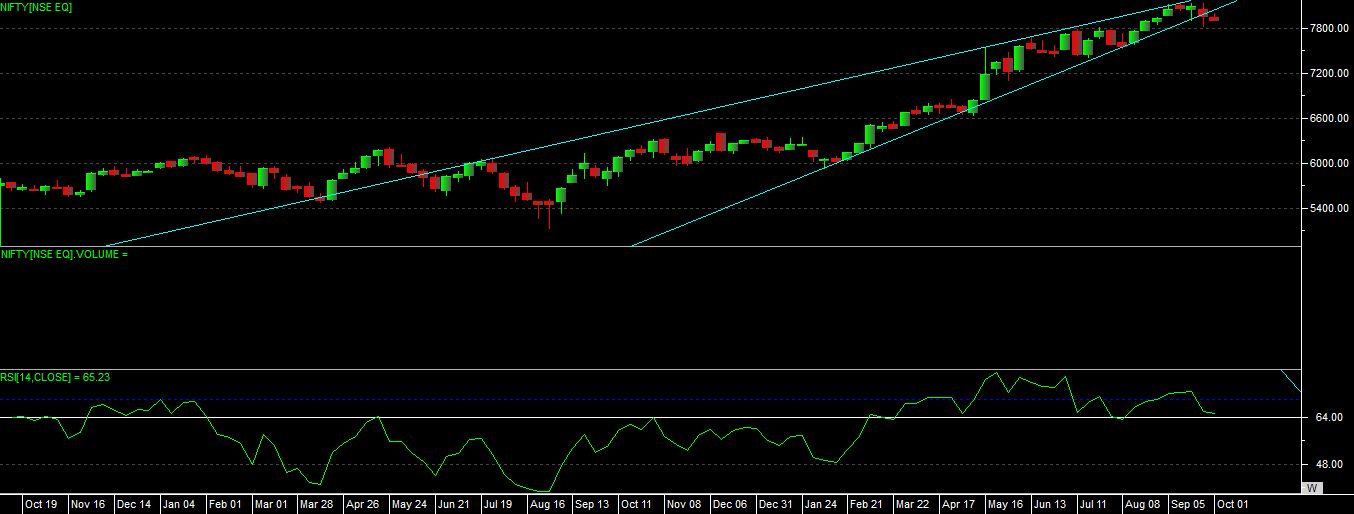
As per weekly chart now we can see that nifty was moving into “RISING WEDGE” and able to test the bottom level last week, so for fresh down trend nifty need confirming red candle below this bottom support level.
Nifty daily chart study – as per daily chart we can see that nifty forming lower high and lower bottom now, and next trend on daily chart can be resume only after the breakdown of these levels. After the formation of “PIERCING PATTERN” prior to last week, it able to move in short range of 100 point for 3 trading session of last week.
On daily chart we seen that nifty able come near or able to touch “50DMA” for four time and even taken bounce also, so again this time on daily chart recent bottom of 7840 and recent top of 8035 seems to be important for resuming next trend.
Nifty weekly chart study – as per weekly chart development we can see that nifty was moving into “RISING WEDGE” channel for almost more than 6 months now, and recently it able to give one bottom below rising wedge channel at 7840 level.
Even with the RSI we can see that nifty making “NEGATIVE DIVERGENCE” on chart now and still waiting for rsi and price level to confirm this divergence now. As per candlestick pattern on weekly chart we see “SMALL STEPPING DOWN” candle on weekly chart, so it seems to be some correction there, need to wait for resume with long term trend further.
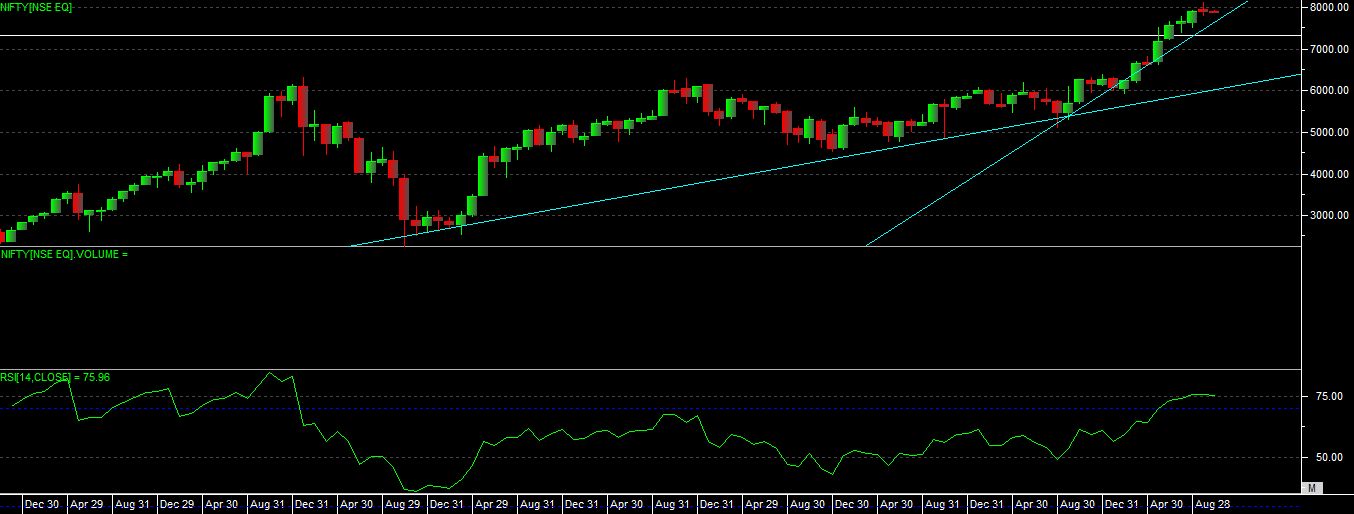
Nifty monthly chart study – as per monthly chart development we can see that it able to made “DOJI” candle last month and this month started with bearish candle development so doji candle low at 7840 level if this month able to close or trade below this level then only we can see bearishness in trend, even on monthly we can see some development of “SWORD” chart pattern we has top level of 8200 so either market has to close below 7840-7800 this month or above 8200 which given clear picture of coming months.
So with overall study if we combine the daily, weekly and monthly chart study, we can see that at present nifty is on important point range of 7800-7840 now, which seems to be important level on all mention time frame.
Overall indication is if it able to break and close below 7800 level then coming month we can see further level of 7600-7400 which is weekly chart support as per the wedge development and if it able to break further then we can see biggest monthly support 7400 and 7200 range, so its seems to market can resume major trend by breaking or taking support at 7800-7840 range. And one need to keep strict eye on any development near to this level, more technical development here can give us better idea of further take on market.
So for coming week down side support level as 7880-7840-7800-7770 and upside resistance level at 7950-8040-8160