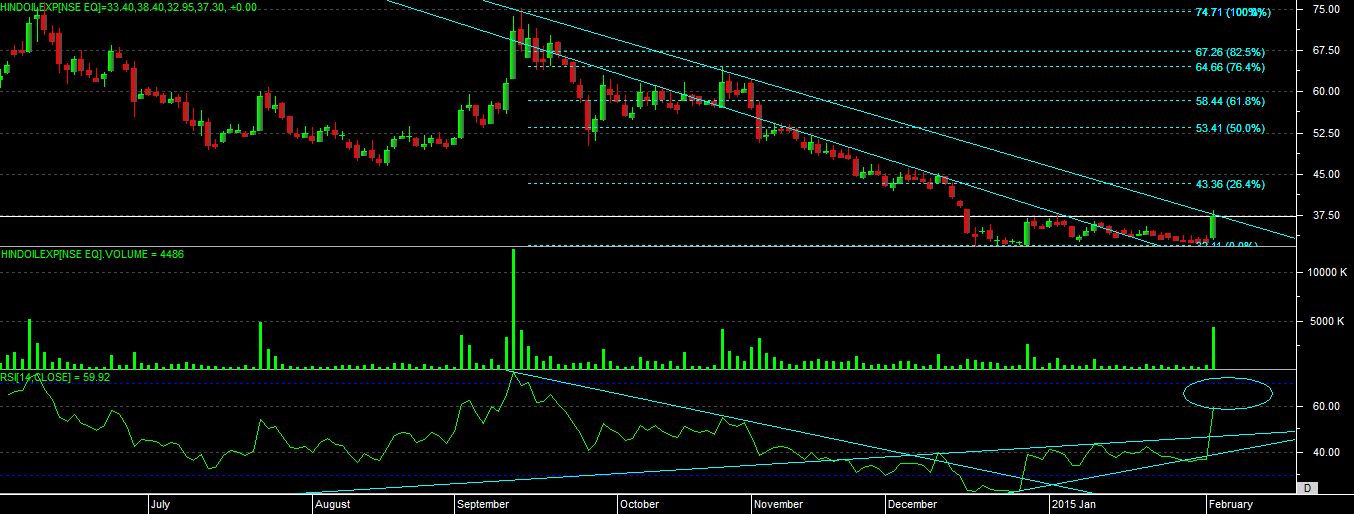
as per the chart we can see that stock was into falling trend from past 6-7 months and recently only it able to move into oversold region now.
today it able to hit the upper trendline resistance with the spike in volume.
it has also given a strong bullish candle on chart.
so overall all expectation is, if price able to move above 39 level which is the recent top near the trendline and if able to sustain for 15-30 min then only we can expect up trend till 43-45 and then after 53-60 range, as of now immediate support at 34 level and final support at 32 level which is the recent bottom of the stock.
so only if above mention levels and condition match then only we can see some good development on chart if not then stock can try to continue its original trend which is down in nature.