as per the chart study we can see that stock has fallen after its issue price at 635-650 range.
chart is yet not developed properly but we can see that on monthly chart is giving STRONG BULLISH candle and on weekly chart it able to setup a bullishness after a “DOJI” candle.
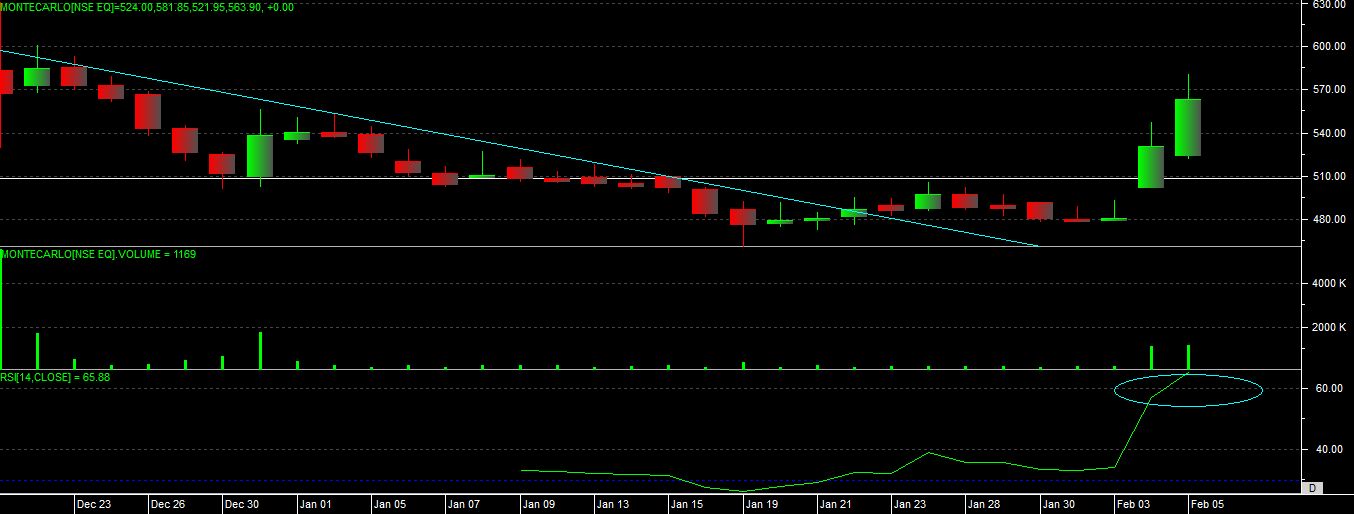
as per daily chart we can see that rsi able to move out from oversold zone now, and as per candlestick it able to give “BULLISH KICKING PATTERN” on chart now.
so overall stock has given a good breakout in a range of 500-540 and having a bottom support at 475 level, on intraday chart also it started to move in higher high and higher bottom pattern now.
so overall we can see that stock can move up if it sustain its gains with the immediate support level at 510-500 and we can see a jump or accumulation in a range of 540-560, and if support sustain here then its open for a one more up move till 610-650-720 levels in next 5-10 trading session, but if it able to break the support then one should avoid the expectation of up move because it can indicate that stock is not willing to follow the said bullish patterns.