STOCKMARKET360

Get Top latest market news, Stock Market Views, Stock Market Updates and analysis on stock, derivatives, commodity and IPO markets. Get all Stock market news, BSE, NSE, Sensex Nifty, world markets, Indian markets, stock recommendation, Dalal Street, Day trading, futures, options, SEBI, market news, Business and other Financial News.

INGERSOLL-RAND – TECHNICAL CHART STUDY

2015Feb-INGERSOLL-RAND INDIA LTD-800x600

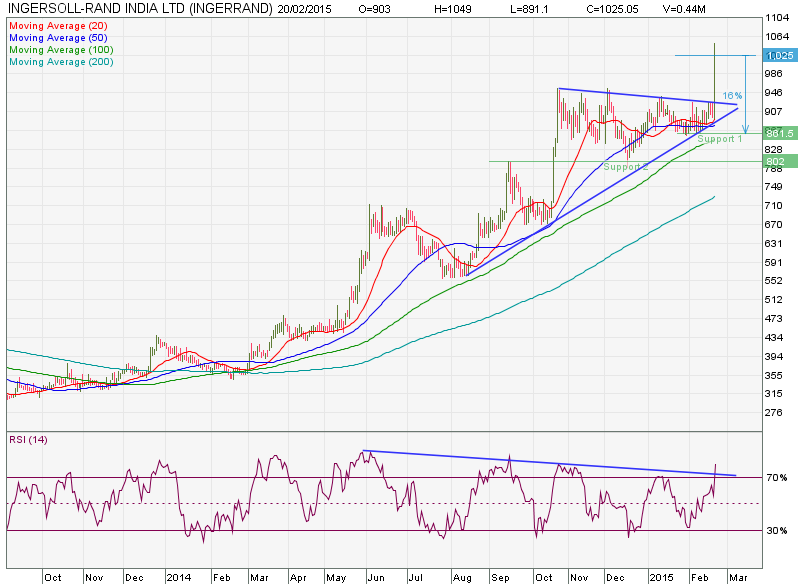
as we can see that stock able to break all the recent highs in last session, with the confirming the pattern of “SYMMETRIC TRIANGLE” and moving well above all the averages,

rsi in in over bought zone, but its a reaction zone, if stock is highly trending then we can expect a high reaction here, need to play with levels.

so overall basic study indication that if price able to move above 1050 then with support of 960 we can see up move till 1120-1170

also one can look for buying zone at 1000-1020 range.


Leave a Reply

Your email address will not be published. Required fields are marked *

STOCKMARKET360 © 2017