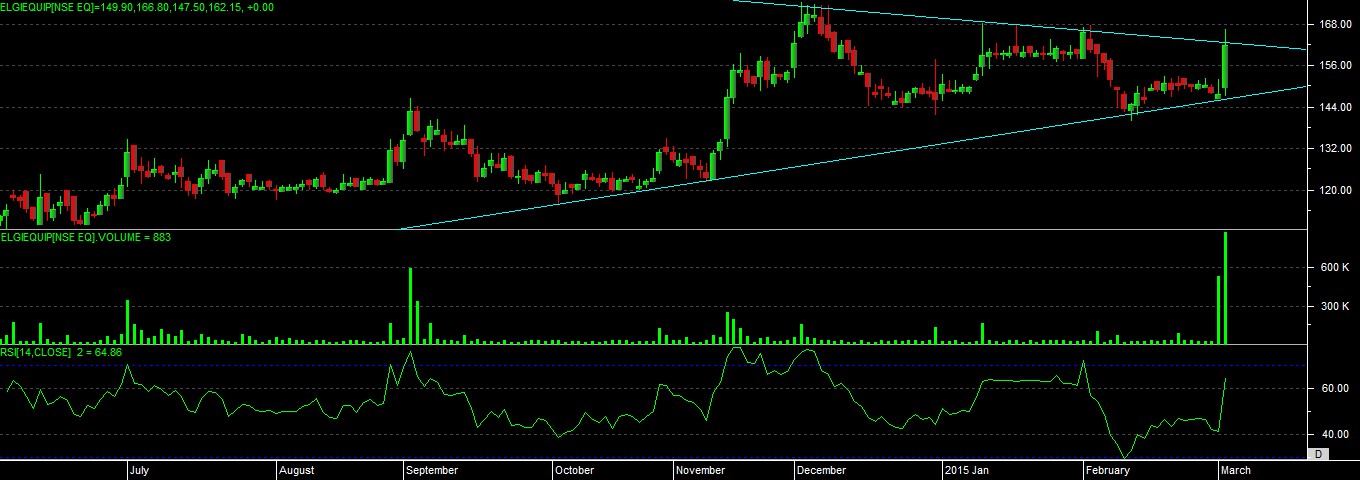
As per the chart we can see that stock has made “SYMMETRIC TRIANGLE” chart pattern and able to hit the upper resistance level in last session.
even candlestick has given a strong bullish candle on chart, with rsi still trying to move into overbought region.
at this bottom reversal we seen a good and huge volume on chart which can indicate us about the breakout move of same.
so with the overall basic indication we can look for a good breakout above 166-169 range, if price able to cross this range and sustain or close above mention level then stock will look for a forwarded move of 30 rs and can be more also till 200-225 level with the strong supporting levels at 155 for now.