time 3.53
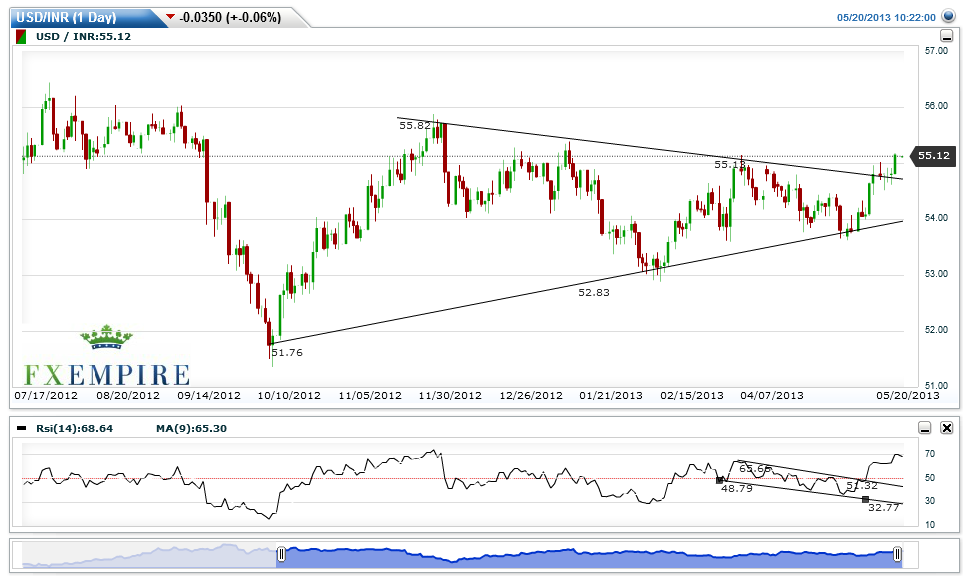
POSITIONAL BUY USD/INR @ 55.10 sl 53.50 target 57.50-60-63
Technical study view – trend line study suggesting that USD/INR chart has broken the TRIANGLE PATTERN on chart on 10/05/2013 and made high of almost 55 level. So now if it break 55 and give close above 55 then we can see triangle breakout.
RSI study on USD/INR chart suggest that its has created positive divergence on chart RSI broken the recent low but on chart price unable to break the recent lows so it’s a clear sign of divergence on chart.
So according to technical study given in above chart it clear indicate that USD/INR has given some reverse buying signal @ 53.75 level and now its waiting to confirm the original trend above 55 level. And able to do breakout above 55 then we can see 57.50-60-63 levels in coming days also.
www.stockmarket360.in