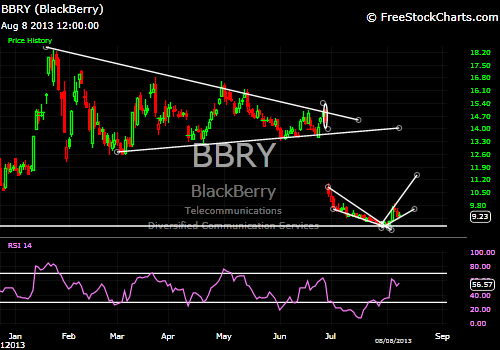
just have a look at the BLACK BERRY chart we can see that it has made SYMMETRIC TRIANGLE chart pattern from feb. to July period, and just see before the massive fall it has already given a indication of this fall, just one day before fall it has tocuhed the upside resistance line of triangle and also given a BEARISH ENGULFING candle on chart which clearly tell us that stock has faced major resistance at that level..
and just see what happen next stock open massive gap down of almost 25-30%.
after this fall stock has created a FALLING WEDGE chart pattern on chart, and able to break this wedge at 8.84 level soon, after a INVERTED HAMMER candle at bottom.
now at present its in a broadening pattern on chart, which is know as ASCENDING BROADENING WEDGE PATTERN, and as per the pattern stock try to rise its high with the rising bottom always, as a pattern goes on it gives a wider range to trade for, so according to pattern trading near support and resistance can give some good out put from the stock.
overall chart study indicate that stock is in long term selling zone now and give some relief rally according to given pattern, long term traders can collect it on support levels with the major level of 8.5 keeping as sl.
stock might do some consolidation here with slowly rising price, so to get out put from this stock investor need to stay invested for a longer time period.