CCUR –
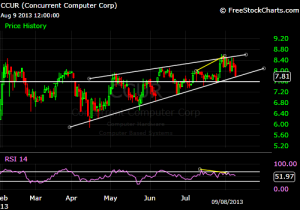
have a look at the chart, stock just touched the support in last trading session.
Its a kind of rising wedge pattern in making, and stock touching the down side support line.
another thing to see is it has created a NEGATIVE DIVERGENCE SIGNAL ON CHART, where price able to make higher high but same thing fail with RSI.
so over all view is stock fallen from its recent high level we can see support at 7.50-7.75 range once able to give 2 positive close from here then only we will be able to see 8.75-9.5-10.5 levels also, but if it give close below 7.50 level then down side we can see correction till 6.75-6-5 also.
