Last we posted USDINR buy call at 55.10 for 57.50-60-63 level below is call given link….
https://stockmarket360.in/2013/05/20/usdinr-positional-technical-call/
after a call it has done with the full target recently…
sell USDINR below 63.50 on closing basis with sl 65.60 target 61.50- 60-58.50
technical chart reading –
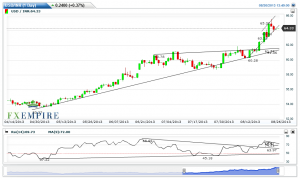
as we can see the chart of usdinr we can see that it has made rising wedge chart pattern and given breakout upper side at 62 level which lead for the movement till 65.60 level.
after that we can see that its moving in rising trendline channel which we can assume as rising flag chart patten having the upper limit at 65.60 and lower limit at 63.50 level.
as per the candlestick chart pattern it has given a “EVENING START” candle on 8-22-2103. after that it has able given negative close on next day also, so one more close below given level can confirm the reversal in trend now which can lead fall till support levels.
another thing to notice is it has made a “NEGATIVE DIVERGENCE” signal on chart but yet we can wait for confirmation as it is confirm on price chart then rsi still having more scope to fall.
so overall chart development, chart patterns and indicators shows that if price able to fall below given level then we can see correction of up move till given support level, if it not able to trigger in selling side then we can see up move above recent high only if it able to find a support at 63.50 level then only.
