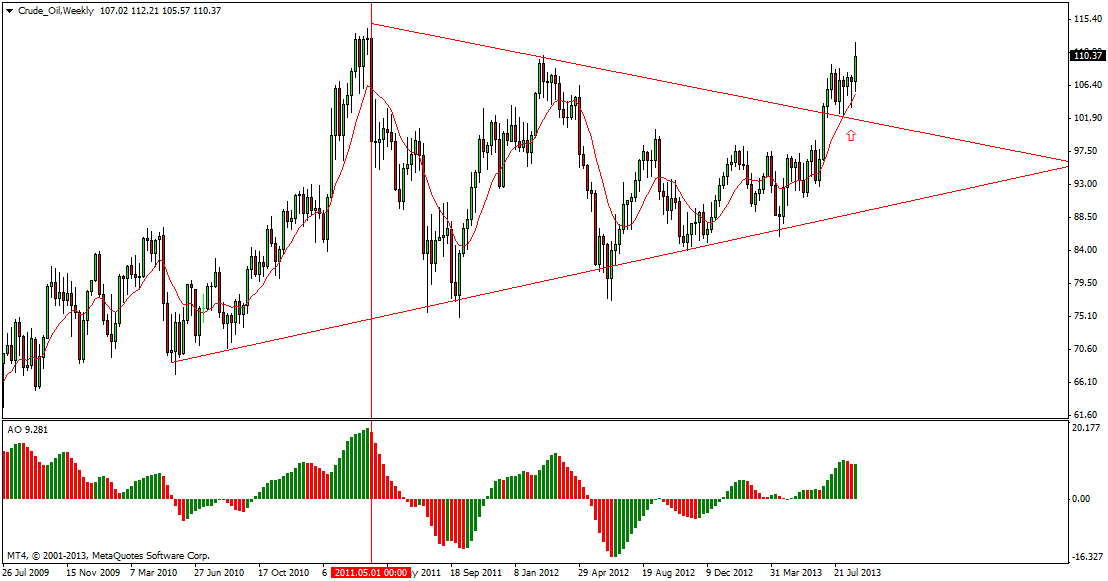
This is crude oil weekly chart where we can see that it has made “SYMMETRIC TRIANGLE” chart pattern on weekly chart and it has already broken the triangle at 103-105 range and now trading at 110.50 level,
triangle is having weadth with of 40 points {114.5-74.5} so on weekly chart its possible to see 40 points move from 105 level…….which come with level till 145 level
when there was a crisis in all over the world in 2008 that time this crude had made the high of 148 level……….
so what we can see with the world economy now…..are we heading for such crisis again but with the diffrent look now or anything else?????
please share all your views and please take our study as a view only…