buy NAHAR SPINNING above 86 sl 75 target 97-120 {hold only if close above 86-87 level}
technical chart reading –
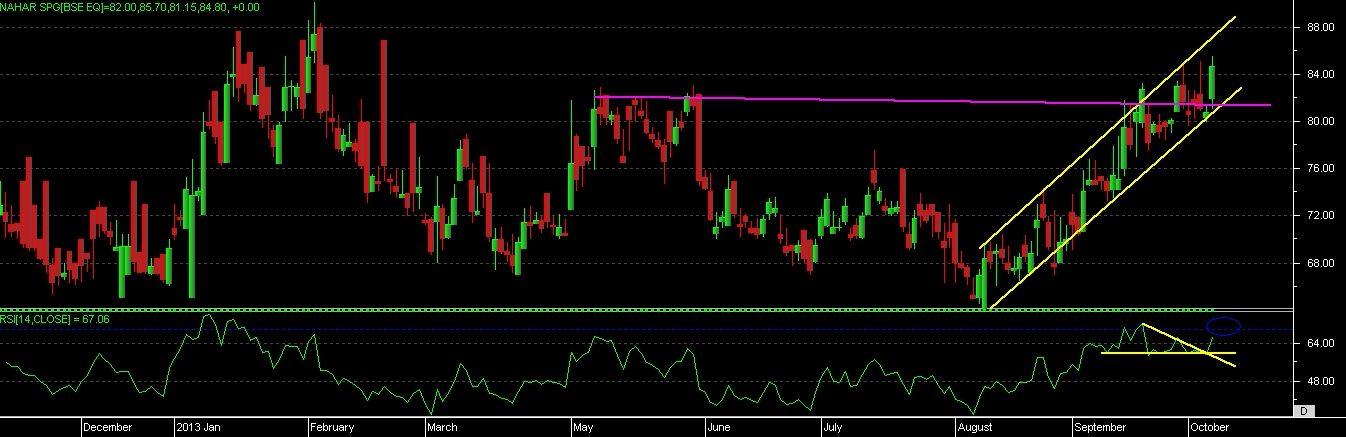
there are few thing we can observe on chart, if we see that chart we can see that stock is moving into upward channel, with the RSI resting under the overbought zone now.
so this is the indication that if stock able to move above given level and close above given levels, then we can sulry see up move in this bcause RSI still having scope to move in overbought zone.
recently stock is able to give good close from past 6 month levels, so this is the indication that in coming future stock can give some good up move.
RSI observation is after moving to the overbought zone recently, it has taken a rest for 1 months time but price was rising slowly, so it is the indication of POSITIVE DIVERGENCE in stock, and now rsi able to move above its resistance level, and even stock has given a good close in last session, so moving above recent high will give more confirmation for up coming up move but holding decision should be taken only at closing price.