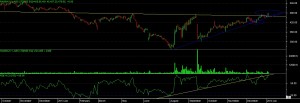
Look at the chart development of ranbaxy, we can see that stock has able to gain strength in past 5 months.
recently we can see that price able to move above long term resistance level.
there is a development of “ASCENDING TRIANGLE” on chart and recently price above to give good close above this pattern.
even price has taken support on every fall on supporting trendline.
look at the rsi development, price not able to show any weakness, but rsi given a weakness in last month, so it was a “POSITIVE DIVERGENCE” development on chart.
with the concern with the above pattern’s we can see that stock is ready for a breakout now, so once price able to move above 482 level one can make buy position in stock, and once price giving close above 485 level with green candle then one can hold the positional long in this stock, with 420 as a sl and target we can see is 580-650-750
