buy CYBERTECH in a range of 26-29 sl 19 add more if close above 31 target 38-45-55
technical study
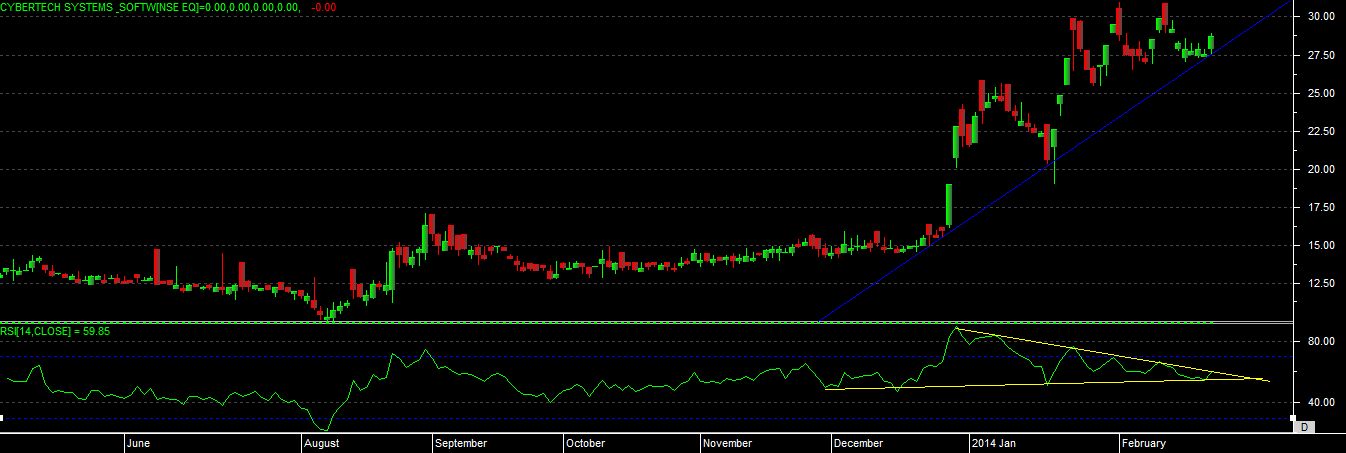
we can see that stock is trading on 52 week high level now, this can indicate that trend is real strong in this stock.
as per the technical chart we can see that stock is taking support on trendline now and showing a bounce.
very interestingly see the development of rsi, price is still near top and rsi presently below the overbought zone, which can tell us that rsi still having scope to move in overbought zone with the price action.
there is a sign of “POSITIVE DIVERGENCE” also, upside it has already given a ” NEGATIVE DIVERGENCE” sign and given some fall till support level.
rsi has developed “symmetric triangle” now so upper price movement can given upper move.
so basic indication from stock is we can buy this in a range of 26-29 strong support at 18-19 range on closing basis, once able to close above high level then will able to give some strong move in coming period.