Don’t get married with the direction of market, make a friendship with trend, because in marriage you’re not always right and when your are right your decision goes wrong, but in a friendship you always get support from your friend, even if you get into wrong direction friends can show you a right way.
So let the direction of market change itself, you just worry about the finding the trend, because if you able to find a proper trend then you don’t need to worry about direction, it may be up or down, you are with trend always.
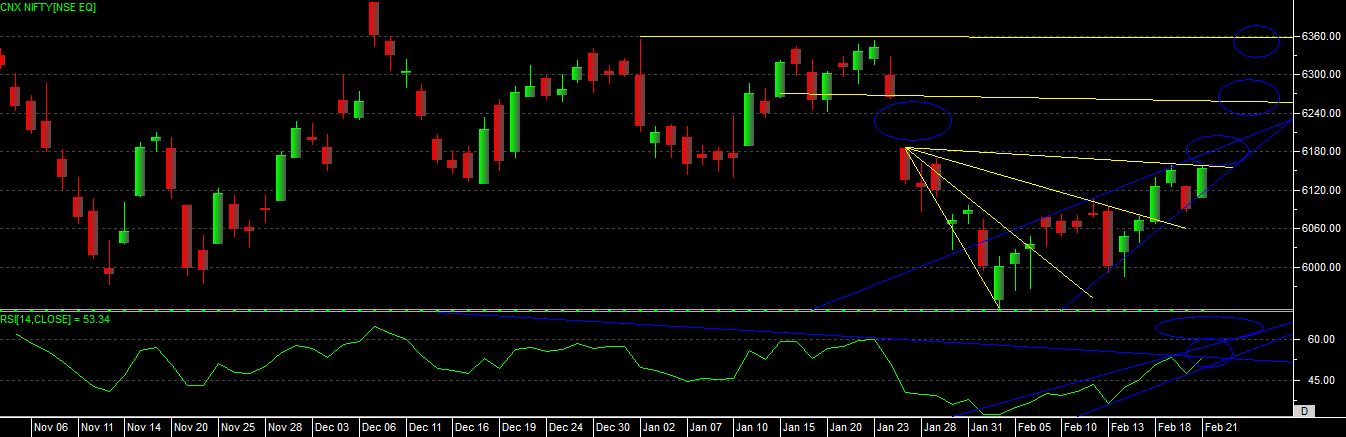
Last week we mention that market having a strong support in a range of 5950-6000 and moving above 6100-6120 close can give up move in market, just see after closing above 6120 nifty able to touch then level of 6160 almost.
Now as per the current chart development we can see there is a development of “RISING WEDGE” on chart, after a development of “BULLISH HARAMI” candle in last week, nifty given a good bounce with concern pattern, and after that it able to develop some more candlestick patterns at upper level recently.
After a “BULLISH BELT HOLD” candle on Tuesday it has developed “EVENING STAR” candlestick pattern on chart, and same was not able to confirm on next trading session which was leaded by again a “BULLISH BELT HOLD” candle again in last session.
Now just look at the chart, after this fall we already mention that it was a development of “INVERTED FALLING WEDGE” on chart so from bottom we can see bounce. And just see this inverted wedge was completed in three stages on chart, 1st at 6050, 2nd at 6106 and now last one just came near resistance of final stage.{6150-6200}
Even if you look at the rsi, it’s also moving in rising channel on chart, which can indicate a strongness in market at this level. And still at this point rsi is trading at middle level, so till the time support in rsi is not broken we can expect a up movement in rsi, as we clearly see that there is a scope for a move.
As per the current pattern chart we can see that now nifty is having a big and final resistance in a range of 6150-6200 {exact level is 6190} {resistance of current rising wedge and already formed “inverted falling wedge which is shown on the chart}.
So if nifty able to pass over this level on closing basis, then it will try to fill up the gap which it has put in last month, so if close above 6200 and if stays positive then will try to fill the gap till 6240-6270 range.
After filling the gap if market stays positive then again we can see more up move till 6350-6370 range.
So overall consideration of study is, after a decent jump from bottom now market again reach to the starting point which is 6150-6200 range we can say, so till the time we not see close above 6200 and one more confirming session above 6200 one can avoid fresh positional long below this level, once it able to confirm this levels then upside we can look for 6350 again.
If any case nifty able to give a negative or red candle near to 6150-6200 range then again we can see a falling movement in nifty, as of now good support at 6100 level so once giving close below 6100 then we can see down side till 6030-5950.
Still we saying that 5950-6450 it’s a range of market and till the time this range is not broken and confirm we can’t see bigger moves in our market, it will be a range bound play till that time, so avoid shorts near to this bottom and long near to resistance.