buy AARTIDRUGS above 286 sl 265 target 297-315after crossing 286 if price sustain for 1 hour then can trail sl at 274 to reduce risk….we given this one buy in todays session also at 277
technical chart study
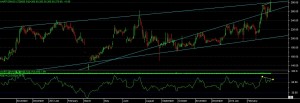
as per the technical chart we can see that price able to move above “EXPANDING TRIANGLE” resistance level, and in todays session it able to touch its long term resistance level.
even rsi also taking support and moving up only from past 10-11 months, and presently it has given a “NEGATIVE DIVERGENCE” signal at top and it can convert into “BULLISH NEGATIVE DIVERGENCE” once price moved above 286 and sustain and close above 286 then.
today it has given a strong bullish candle on chart with the pattern of “MORNING STAR”.
so overall indication from stock is, its trading on life time high level now, so if price sustain here also then one up move we can see in this stock.
but remember if price not able to sustain above our mention level or if it close below sl or if given negative or red candle on chart then it can convert into selling call also, so be careful after rate it trigger, you must apply this condition.
