STOCKMARKET360

Get Top latest market news, Stock Market Views, Stock Market Updates and analysis on stock, derivatives, commodity and IPO markets. Get all Stock market news, BSE, NSE, Sensex Nifty, world markets, Indian markets, stock recommendation, Dalal Street, Day trading, futures, options, SEBI, market news, Business and other Financial News.

SELAN – TECHNICAL CHART STUDY

SELAN_1

buy SELAN 500-510 range sl 420 target 625-725-850

holding time 1-3 month

technical chart study

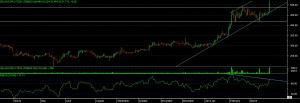
as per the chart we can see that stock is moving into uptrend now, done some consolidation for past 3 months and stock able to move high to 52 weeks high now.

rsi just touch the overbought zone now, which can indicate signal of “BULLISH NEGATIVE DIVERGENCE” on chart.

so overall indication is one can buy this stock with mention stop loss on closing basis and give time to stock for a good movement.
Leave a Reply

Your email address will not be published. Required fields are marked *

STOCKMARKET360 © 2017