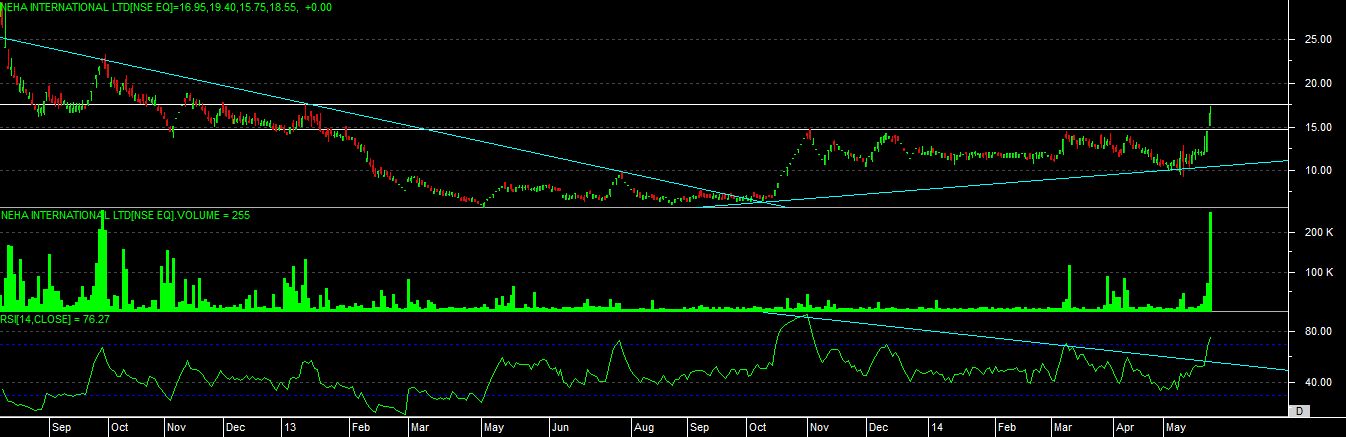
buy NEHA in a range of 15-18.55 add more above 20 sl 8 target 40-65-125-150
technical chart study
as per the chart development we can see that stock has fallen from almost 200 level till rs. 5 and recently it able to move above its 18 months high level.
stock is very well trading above its 100 days and 200 days moving average now.
after a long consolidation stock is moving now, we can see that it has form a rounded bottom, also given a breakout of “ASCENDING TRIANGLE” on chart with the formation of “BULLISH NEGATIVE DIVERGENCE” on chart now.
with the increasing volume price also moving higher now.
so its a indication that if stock able to maintain its range upper side then we can can expect a good bounce in this stock in coming days.
but as we see some horrible movements in this stock before, so we advice to buy and hold very small qty with given stop loss level.