buy NETWORK18 above 43 sl 33 target 60-85-125
technical chart study
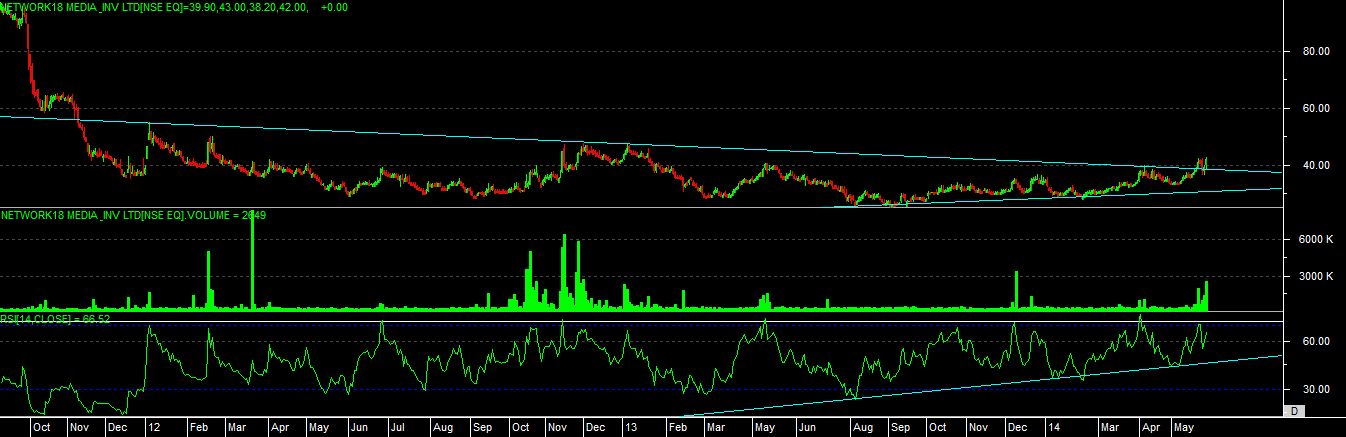
as per the technical chart development we can see that stock was in falling zone for last 3 years and recently its able to move above the range.
it has made “SYMMETRIC TRIANGLE” on chart now, and able to move above resistance level now.
even rsi indicating the reversal of trend on chart now.
if anyone can observe on chart, recently it has given a “POSITIVE CONVERGENCE” signal at bottom level near to 25 and bottom reversal was made at 30 level, now after this reversal its looking for breakout at upside.
at upside now its showing a signal of “BULLISH NEGATIVE DIVERGENCE” which can be confirm only above mention level.
so overall indication is after long time stock showing some bullishness in price and if same will be confirm by moving above mention level then we can expect a good momentum in this stock in coming days.