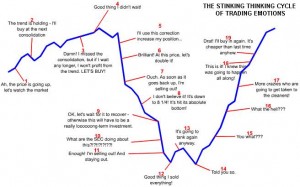
WHEN WE SEE MARKET FORMING SOME BEARISH PATTERN OR CANDLES AT UPPER LEVELS IT’S A CLEAR INDICATION OF CONSOLIDATION OR A PROPER CORRECTION, SO WHEN SUCH THING HAPPEN ON CHART, THAT TIME INVESTOR SHOULD THINK TWICE BEFORE TAKING ANY POSITION, BECAUSE MARKET IS A TIMING GAME, SO TRY TO ENTER AT PROPER LEVEL ONLY WITH PROPER INVESTMENT, IF MARKETS ARE NOT MOVING THEN STAY AWAY FOR SOME TIME, ONCE IT OUR FROM RANGE THEN ITS BETTER TO ENTER AGAIN.
“TIME IS A MONEY, BUT IN A MARKET WASTING {WHEN MARKET IS CONSOLIDATING} A TIME IS BETTER THAT WASTING A MONEY”
As we are mention from past two week that market will be doing a consolidation in a range of 7150 and 7665 range and even in last week it kept the same range of 7505 to 7118, as we inform in last week that buy near to support and sell near to resistance, because consolidation phase can give good gains with this tactics.
As per the chart pattern we can see, last week nifty has given a fall only, do this can indicate some correction in a market.
As per candlestick pattern, it has given a “HAMMER” candle on last trading session of the week, and this hammer candle is known for the trend reversal.
If we look at the rsi development rsi is little bit calm down now and able to come below 70 level, which can also indicate that if market take support on mention level, then possibilities of good bounce can not be avoided. But it need to take support, if not able to take support at proper level then it will try to complete the correction.
Now if we look at the weekly chart, we can see that it’s a much more important now to decide further trend, as per weekly chart there is a development of “BEARISH ENGULFING” pattern at this top level, so bull traders need to be worried at this stage now.
So our overall view is, after the important even market went into the consolidation with some correction mode, so positional trader or investor can enter again at support level, which is between 7000-7100 range once this range is broken then can wait for more time to get over this correction.
As per chart we can see weekly range at 7100 to be bigger weekly support now, below this 7000-6900-6800 also possible, if taken support at 7100 with green candle close then upside we can see 7250-7350-7550-7660 also.
Major directional changes we can see beyond 7000-7665 range only.
