DECIDE YOUR SELF WHAT KIND OF TRADER YOU ARE
ARE YOU AN INTRDAY TRADER???
ARE YOU A LONG TERM INVESTOR???
ARE YOU A SHORT TERM INVESTOR???
ANSWER THIS QUESTIONS BEFORE TAKING ANY POSITION, BECAUSE WHAT HAPPEN MOST IS, PEOPLE TAKE POSITION FOR INTRDAY, WHEN IT NOT MOVED FOR INTRDAY THEY HOLD IT FOR A WEEK, WHEN IT FALL MORE THEN THEY HOLD IT FOR A SHORT TERM, AND FINALLY THEY ENDED WITH HOLDING SUCH SCRIPTS FOR ALMOST LONG TIME.
INTRDAY TRADER TAKE LIMITED AND CALCULATED RISK ON HIS INVESTMENT.
SHORT TERM INVESTOR KEEP BOOKING SMALL PROFIT AS PER THE MOVEMNTS.
BUT LONG TERM INVESTOR NEVER BOOK PROFIT AT ALL “THEY BOOK SCRIPTS”
“MARKET IS A PLACE WHERE SUCCESSFUL INVESTOR USE PENNY TO MAKE POUND” – “SUCCESSFUL INVESTOR NEVER USE POUND TO MAKE PENNY”
Last we mention that 7600 was key level above this level nifty able to hit 7700.05 level and below this it came down till 7525 level in last trading session.
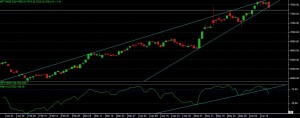
As per the current chart development we can see that, nifty moving in “RISING WEDGE” channel now, and in last session it able to touch the bottom level of rising wedge, so yet we can’t assume that market can fall, but if able confirm the wedge breakout then we can expect a good correction in our market.
As per candlestick pattern, it has given a “HANGING MAN” candle in last week, also after that it has given a “DOJI” candle on chart and same was followed by a “BEARISH ENGULFING” candlestick pattern on chart.
Last week, it has made a “TWIZZER BOTTOM” pattern in a range of 7580-85 and after breaking this level we seen good fall in last session till 7526 level.
Even rsi able to move below overbought zone now, and its also below support level on chart, which can indicate that, either market can go for good correction or it can look for some divergence signal in between, which can lead for a bounce back again.
On a weekly chart we can see that it has form almost like “SHOOTING STAR” or we can say “GRAVESTONE DOJI” candle on upside.
So overall indication and patterns are suggesting that market able to form some bearishness at upper side now, but yet support is not broken. So next coming week is much more important to decide the market direction.
As per chart, after a rising wedge nifty is having unfilled gap in a range of 7470-85 range, so overall we can say that, for next week there are two much more important support level as per chart, one is rising wedge bottom level of 7500-7515 range, and other one is gap level of 7470-85 range.
So overall we can say that 7470-7515 range is important support level for nifty on closing basis, if nifty able to close below 7470 level then only we can expect a good correction till 7350-7200-7100 and even more also, as this wedge is having a width of almost 600-700 points.
For any reversal, if it able to given green candle with bullish nature near to our mention support level then one can go along with given support level as stop loss on closing basis, and if this reversal is form on bottom level then market can again move up till 7600-7700-7820-7950 levels also.
So important overall conclusion is 7470-7515 is a key range which can decide the direction of market, moving below range on closing basis can lead for good correction, green close on this support can lead for a good reversal, so one need to be careful near to this range.
Remember yet market not moved into selling zone, as its not even breaking the initial support trendline, so this recent fall we can assume as a profit booking, but also remember that below mention level if market close for 1-2 session the actual correction can take place.
