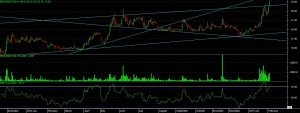
as per technical chart development we can see that stock is moving into strong up trend and breaking almost 4.5 years high level now.
on a daily chart we can see that stock is moving above resistance trendline and also breaking channel now.
RSI clearly showing bigger divergence at upper side.
it also able to break expanding triangle upper level.
so overall stock is in bullish move from 32-33 range with down side immediate support at 27 level and can look for up move till 45-50-65 in coming time.
stock also can perform good in long term with the support level of 19 for the up move till 65-90-150-200 also
