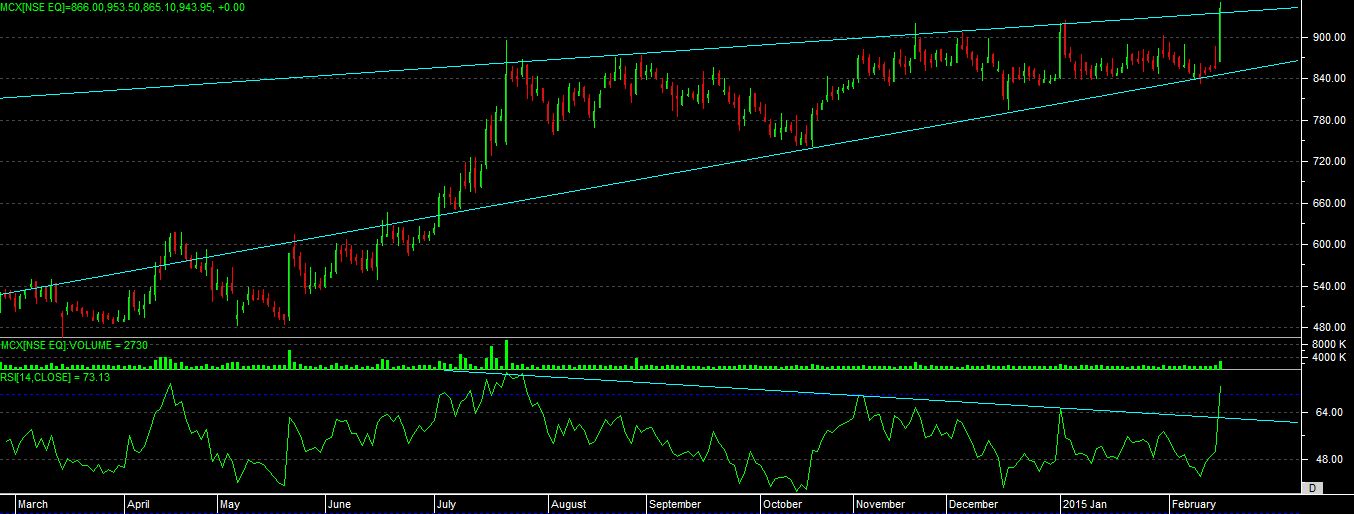
As per the chart development of mcx we can see that its has done almost 7 month consolidation on chart within the range of 200 rs.
as per the rsi study we can notice that last two time it fail to give a proper “NEGATIVE BULLISH DIVERGENCE” but at this stage we can notice that price as well as indicator both are in force now and looking for next upcoming up move.
again its a pattern of rising wedge on chart which able to touch and close above upper resistance level in last session.
once thing to notice here in clear manner is, if you see long term chart of mention stock, then we can notice that, in December 2013, 1st time stock move in oversold zone, and then after what it done was, consolidation and then up move, without moving into oversold zone.
like wise in a period of January 2014 to June 2014 it has done consolidation and then resumed its up move, so at this point of time also, stock looking for same move, as it able to reach the upper resistance level.
so with the overall study, we can get indication is, if more more green candle we see on chart above resistance then we can get the confirmation of this up move which can lead for 150-200 rs. move which is as per pattern develop on chart.
so one can look for buying near to 920 level, safe trader can look for entry above recent high of 955 with the down side support level at 865 and 890 upper side level open for 1020-1100-1170