MARKET IS A PROCESS OF DECISION MAKING, SO PROPERLY JUDGE YOUR DECISION BEFORE YOU TAKE IT
DECISION WHICH DEFINES YOUR POSITION, BUT THIS DECISION MUST INCLUDE PROPER STUDY, TIMING AND RISK CAPABILITIES, AND MANY MORE OTHER FACTORS IF YOUR MAKING DECISION ON THESE THINGS THEN EVEN IG YOU FAIL IT WILL GIVE YOU NEW LEARNING LESSONS, BUT IF YOUR DECISION MAKING PROCESS IS WRONG, THEN YOU CAN FACE FAILURES NUMBER OF TIME.
Last week we clearly told that nifty has made some bearish candlestick pattern at recent top levels and we mention level of 7770 but it fall almost near from this level.
Recently it made “HANGING MAN” last week after that it made “BEARISH ENGULFING” candlestick pattern on chart and this bearish patterns followed by “LONG LEGGED DOJI” candle which was formed on a day of “BUDGET 2014”
So over all patterns which formed in last week has suggested some selling at upper level again and again, which indicate us that market is not comfortable with this top now, and that’s why its giving some specific range correction every time.
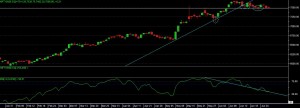
As per the current chart of nifty we can see that rsi is calming down now but price still sustaining the recent low level of 7440 almost, so as of now we are assuming this level as a “KEY LEVEL” on closing basis.
Even it has taken the extended trend line support on chart now, but we seen a weak weekly closing this time on a weekly chart it has given a “BEARISH ENGULFING” candle which is very well known for trend reversal.
Even a monthly candle is also started with some bearish formation but as of now we cant assume any patterns now, we can wait till candle get completed.
So as of now for current week we can see that 7740 is important support level but with the extra volatility in market we are giving some buffering to this level so we can consider level of 7400 now.
If nifty able to form any bullish or reversal pattern near to this support level then only we can see some good reversal in market which can given us upside 7550-7700-7825-7950 also.
But if market able to move and close below 7440-7400 range then we can expect some good correction which can lead for a fall till 7200-7100-6950-6800 also.
So one need to be very careful near to this level, as level or range looking to be highly important which can decide the further trend of the market.
