WILL IT BE A HIGHEST EVER YEARLY CLOSE BY MARKET IN YEAR 2013????
ALL TIME YEARLY HIGHEST CLOSE WAS AT 6138.60 IN A YEAR 2007, AND AFTER THAT EVERYONE KNOW’S WHAT HAPPEN, NIFTY MADE LOW OF 2252.75 IN 2008.
IF MARKET GIVE RECORD CLOSE THIS YEAR, THEN WHAT NEXT????
WELCOME TO 2014 – INTERESTING YEAR TO WATCH OUT – WILL IT REPEAT A HISTORY {OF 2008} OR WILL IT CREATE A HISTORY?????
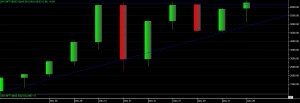
AS PER CHART NEXT LONG TERM BULL RUN CAN START IF NIFTY GIVEN MONTHLY CLOSE ABOVE 6450 LEVEL, BUT IF IN ANY MONTH IN COMING YEAR IF NIFTY GIVEN CLOSE BELOW YEARLY CLOSE THEN WE MAY SEE ENTERING THE BEARS INTO THE MARKET.
SO TWO THINGS TO WATCH OUT AND NOTE DOWN IS YEARLY CLOSE OF 2013 AND 6450 LEVEL FOR FRESH BULL RUN.
Last week we mention that market has taken a support in a range of 6100-6150 and till this level is sustain we are looking for up move only, we mention level of 6350 upside and market able to move till 6325 from weekly bottom of 6260.
With the current chart development we can see that last week market has done consolidation, and given a dull movements on expiry day, still this was the 2nd highest expiry level {6278.90} after a month of October {6299.15}, so psychologically market still keeping its level high for the year 2013.
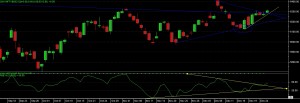
With the chart we can see that market able to move above its resistance level in last trading session, and even RSI moving upper level after crossing the resistance.
It’s a “SYMMETRIC TRIANGLE” development on chart now, and market able to move above the level, but wait still confirmation of this up move is pending, without confirmation we cant take our next decision.
So for the current week, if nifty able to move above 6325 level and able to sustain above this for 1 hour then some strong buying can come, and if close positive above 6325 then positionally we can see upper side 6385-6450-6500 levels in upcoming sessions.
Downside we can consider two immediate support levels at 6280-6250, once able to give close below this range then we can see 6150-6050 also.
So overall for fresh trades one can think to go long above 6325 {need to sustain for 1 hour} and if market face resistance here, then take a sell position with the stop loss which is near to 6325 {stop loss depend on intraday levels, which market can make by even gap up above 6325, if not open gap up then 6325 should be consider as sl but after 1 hour of trading}
Monday session – if open gap up then wait for 1 hour, and if market not break high in 1st hour then sell with high as sl, if open gap down then wait for 1 hour even after that of 6325 not cross then sell with 6325 sl. If after gap up market cross the high level, or after gap down market cross the 6325 then it will be a buy signal.

