“Navigating Nifty 50: Deciphering Trends, Identifying Resistance, and Unraveling Potential Market Moves”
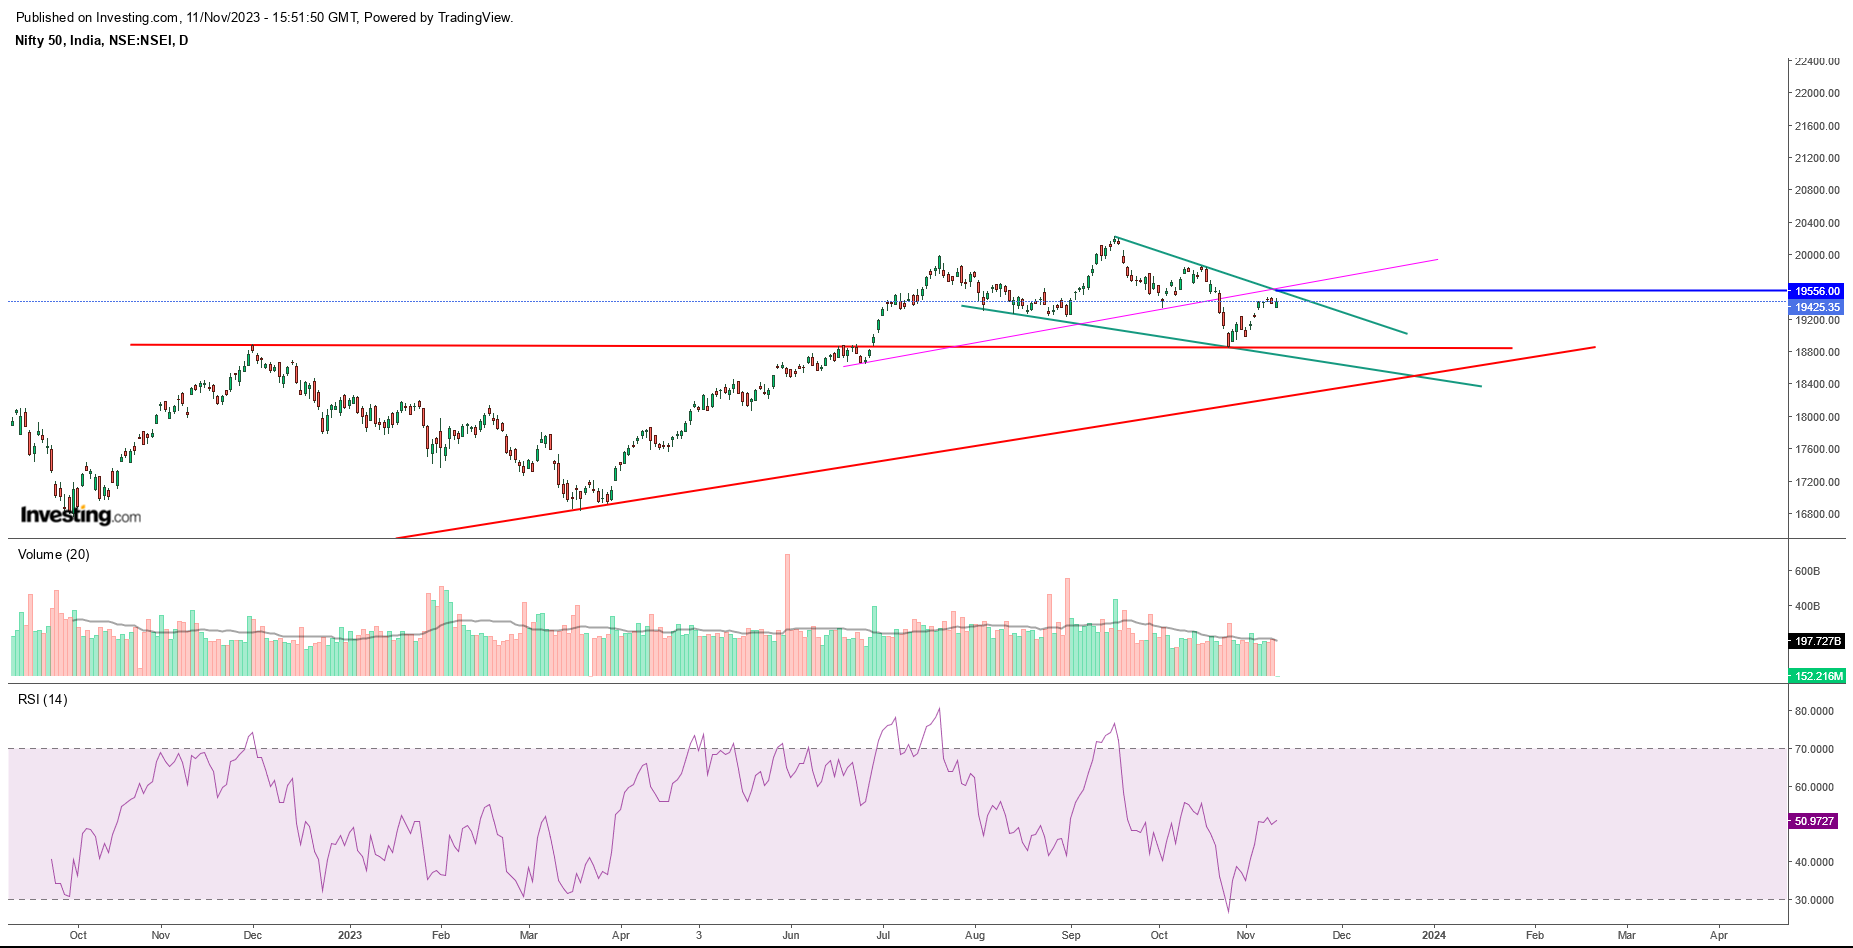
In recent market analysis, we observed a noteworthy shift in the trajectory of Nifty 50, as it transitioned from an oversold state, orchestrating a anticipated pullback rally near recent resistance points. Delving into the daily chart, it becomes evident that following the bottom at 16850 in March 2023, Nifty embarked on a robust upward movement characterized by higher highs and higher lows. However, the narrative took a turn as the index began to formulate lower highs and lower bottoms from the 20222.45 levels. This trend reversal solidified with the breach of the crucial 19500 level, ushering in a pullback phase.
As of the current chart analysis, the primary focal point is the upside resistance zone spanning 19550-19600. Should Nifty test this range and fail to sustain or close above it for two consecutive days, the formation of lower tops would be confirmed. This bearish signal would be further substantiated with a close below the support level of 19334. A breach of this point would set the stage for a downward trajectory, potentially leading to levels of 18850-18690-18340. A weekly close below 18300 could intensify market concerns.
In essence, the analysis emphasizes that if Nifty 50 successfully crosses and closes above the 19600-650 zone, the current rally is likely to continue, paving the way for a new market peak. However, a scenario where the market encounters resistance in the 19550-600 range and undergoes a downturn, confirmed by a close below 19334, would herald a significant market decline, potentially reaching levels of 18850-18690-18340.
Investors are urged to exercise caution and prudence in managing their short-term and long-term portfolios. As long as Nifty maintains levels above 19334 on a closing basis or surpasses the 19650 threshold, the market remains relatively stable. However, a resistance near 19550-600 or a close below 19334 should prompt profit booking, with a strategic wait-and-watch approach until the market reaches the aforementioned lower levels.
In summary,
- Current Nifty 50 CMP: 19425.35
- Upside Resistance: 19556-19600
- Upside Breakout Confirmation: Above 19650 (closing for two sessions)
- Downside Support/Breakdown: 19334 on a closing basis
- Downside Targets: 18850-18690-18340
This comprehensive analysis aims to provide investors with a clear roadmap for navigating the complexities of the current market scenario. It is crucial for market participants to stay vigilant, adapting their strategies based on key resistance and support levels for optimal portfolio management.