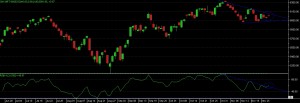
as we can see the nifty chart development, we can see that on positional chart market face resistance today and not able to move above 6120 level for the day.
now look at the development of rsi, rsi able to move above resistance level, so its indication that if next bar is green on chart then we can see up move for coming days.
as per candlestick patterns, we can see that there is a development of “MORNING STAR” candle on chart and todays session it has given a “DOJI” candle, so it can also give us a indication that if nifty moving above 6125 spot level then we can expect move till 6200-6250 also.
even this pattern we can also assume as a “SINGLE CANDLE ISLAND REVERSAL”.
so overall view is market is having very strong support at 5950-6000 range now, and upside moving above 6125 level and sustaining for 15 min to 1 hour can produce movements till 6200-6250 also.
but this is just a presentation of current situation, further developments will be clear after fresh chart developments.
