TRY TO DIFFERENTIATE THE TREND, WEATHER IT IS SHORT TERM, PRIMARY TREND, LONG TERM TREND OR SECULAR TREND AS A GENERAL TRADERS OR INVESTOR PEOPLE NEVER WAIT TILL SECULAR TREND, BUT SECULAR TREND IS THE KEY OF THE GAME, IF YOU ABLE TO IDENTIFY IT WITH THE SUPPORT OF OTHER TREND THEN YOU CAN EVEN SEE PRICE MULTIPLICATION FOR COMING YEARS, AND STILL THERE ARE LOTS OF EXAMPLE OF IT EXITS IN A MARKET.
SO AS A TRADER, INVESTOR OR TECHNICAL PERSON ONCE SHOULD FOCUS ON PRICE TREND, WHICH REAVELS THE MAJORTIY OF THE MOVEMENTS IN THE MARKET.
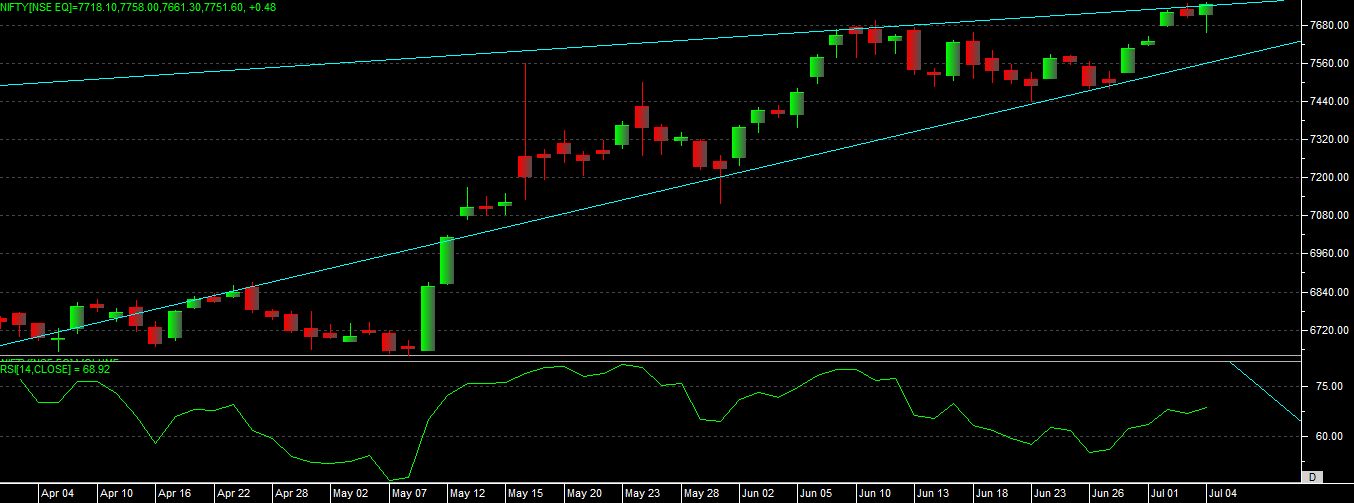
As mention last week that one can buy near to support level of 7450-30 range, with small stop loss, and just see market able to bounce last week as we had already mention reversal patterns of “MORNING STAR”, “INSIDE BAR” and also a “DIVERGENCE”.
As per current chart development we can see that nifty has made again a new life time high now. In last session it has given a “HANGING MAN” candle, and even there is a resistance of trendline now.
Recent trendline pattern developed is seems to be “RISING WEDGE” now, where as nifty able to hit the upper level of wedge now.
After filling the recent gap, nifty has given a sharp bounce in last trading session, so this is the indication of bullishness now.
Now look at the rsi, as we mention last week it has given a “POSITIVE DIVERGENCE” it able to give good bounce from that level and now its having a scope for moving into overbought region again, subject to price must move above resistance line on closing basis.
So overall situation is bullish at upper level now, but one can keep levels in mind before entering at upper level, because if it is not able to confirm the breakout then top reversal possibilities can not be avoided.
Now upside resistance level as 7770 level on spot nifty if able to close above this level then upside we can see level of 7850-7950-8100 also.
Any negative candle near to this resistance can suspect a short term trend reversal, down side support levels at 7650-7600- 7500-7440
Major trend reversal can be spotted only if spot nifty able to close below 7440-30 level till this time we can expect a correction and bounce, so coming week one can buy above breakout levels only or try to enter at mention support levels only.
If you look at the chart of nifty we can see that its almost more than 2 years market is moving in up direction with small corrections in between, so this trend we can see as a “SECULAR TRNED” now which can even last for more 5-7 years’ time period. So even if there is a correction in market then that should be assume as a short-term, intermediate term or a long term trend correction and at the matching point of this three trends one should keep a buying mind set, because from such points market always reverse for a big moves.