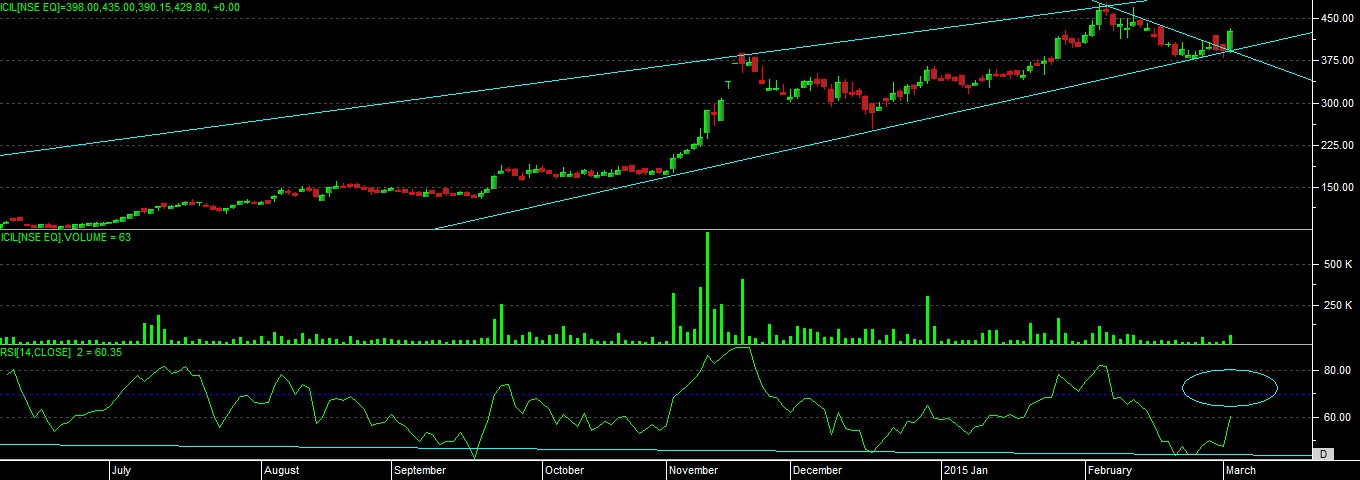
As per the chart of the stock we can see that stock has made bottom on supporting trend line.
where as there is a STRONG BULLISH DIVERGENCE” is taking place on chart now.
stock is also moving into rising channel now.
last session we have see a strong bullish candle on chart, with the hammer at bottom and next day confirmation.
rsi also scoping for upper move now with the possible development of “NEGATIVE BULLISH DIVERGENCE”
so overall basic study indicate that if stock has form its bottom level then possibility it can look to go for new high level now which can give us a breakout level at 435-440 range and if sustain and close above this range then upside we can see 475-485 and then till 515-540 also but need to keep support level in mind at 420 and final bottom level of 380 for this up move, as we can use only recent bottom as an support of up move expectation.