Positional call – buy RPOWER above 77 close sl 59 target 100-115-140
holding period 6-10 months
if not able to cross 77 and close above this and if stays or close below 71 then we can see fall in price again down side 58-50 support levels.
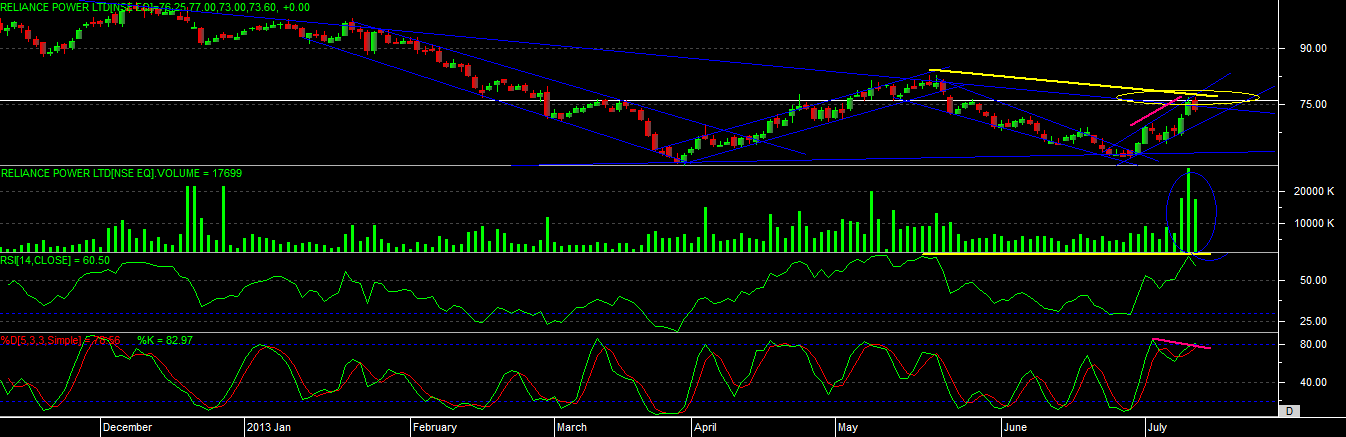
technical study – If we look at the chart then can easily identify that stock is in long term down trend and recently made a life time low also, but past few trading session we have seen some decent up move with price with the rising volume, this can indicate us that traders and investors are gaining conference in stock again, but still we will assume how technically its good on chart now.
support and resistance trend-line showing that its a symmetric triangle pattern and it just able to move above resistance trend-line and made 77 level recently, so major breakout should be consider above this only.
if we observe trend-line channels on the chart then it can clearly show that from past 7 month stock is moving into channel range, and recently it started to move in upper channel range.
again if we can look at the chart we can see that it has just for a DARK CLOUD COVER CANDLE on chart, which can also tell us that, if stock not able to move above recent high and able to trade negative for next 2 session then we can see the fall also, and will confirm the reversal in trend.
other studies telling us that it can confirm the bullish negative convergence on chart with RSI if cross high level and also can confirm bullish negative divergence with STOCHASTIC also. but mark it only above given levels only.
just look at the volume its increasing from last 2-3 trading session, but price need to confirm the same about the buyers interest, if not able to confirm the interest of buyers then we can see reversal in stocks.
overall technical study indicating that stock can show some buying interest above 77 level only if not able to go above this and give 2 negative close on chart then it can also confirm the reverse selling signal on chart.