
Nifty 50 Technical Analysis – Unveiling Potential Trends and Key Support/Resistance Levels
In the world of financial markets, analyzing charts is a fundamental tool that traders and investors use to gauge the direction of asset prices. One of the key indices in India, the Nifty 50, has been displaying interesting patterns and signals on its weekly and monthly charts, providing valuable insights for market participants.
Weekly Chart Analysis: The Rising Wedge and Bearish Divergence
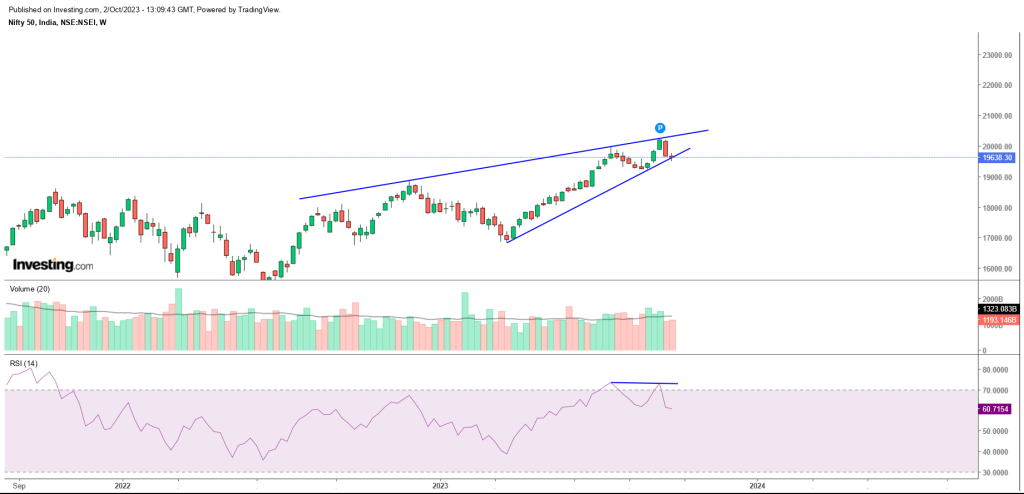
On the weekly chart, a notable pattern has emerged – the rising wedge formation. This pattern is characterized by converging trendlines, with higher highs and higher lows, but it often signifies an impending reversal. In this case, the price has been oscillating within these converging lines, highlighting a potential decision point.
Adding to this, a bearish negative divergence has surfaced. Divergence occurs when the price action and a technical indicator, such as the Relative Strength Index (RSI), move in opposite directions. While the price has been making new highs, the RSI has failed to follow suit, signaling potential weakness in the market. However, it’s essential to remember that such divergences are not confirmed until price action validates them.
Confirmation typically occurs when the price breaks a significant support level or the trendline. In this instance, the trendline support rests at the recent bottom level of 19,492.10. A weekly closing below this level could indicate a forthcoming correction in the market. If the rising wedge pattern confirms, we might anticipate a target around 18,200 in the Nifty 50. Strong confirmation of the divergence would occur with a weekly close below 19,200 points.
Monthly Chart Analysis: The Importance of Higher Highs and Bearish Divergence
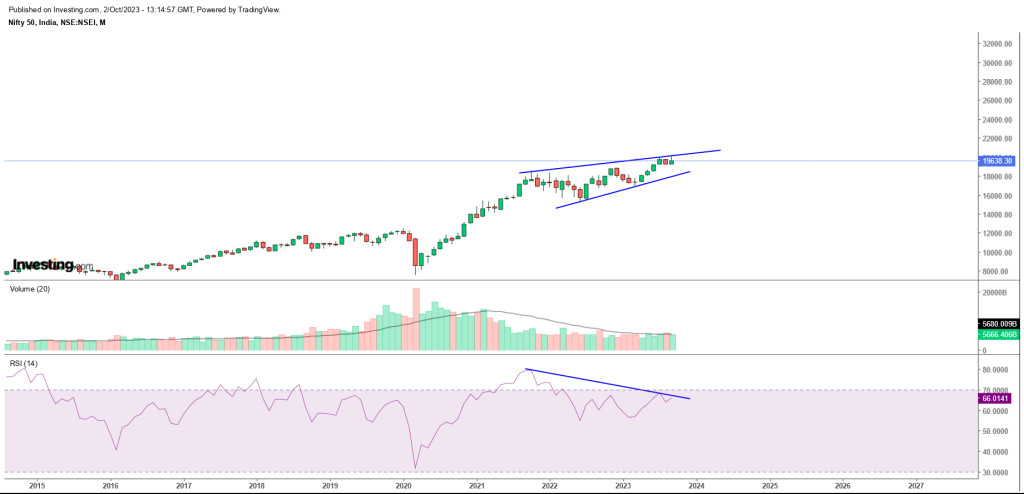
While the weekly chart offers important insights, the monthly chart can provide a more robust understanding of the prevailing trend. Currently, the Nifty 50 is in a seemingly strong uptrend as per price action, consistently forming higher highs. However, a closer examination reveals the emergence of a bearish divergence on the monthly chart.
Bearish divergence in the monthly RSI suggests a weakening of momentum despite the price continuing to make higher highs. For this divergence to be confirmed, it is crucial for the price to move below and close below the key level of 16,800 on the monthly chart.
Key Support and Resistance Levels: Weekly and Monthly
In summary, the current market status can be described as “strong and in range,” primarily characterized by the ongoing consolidation within the rising wedge pattern on the weekly chart. Key support levels to watch on the weekly chart include the range between 19,200 to 19,490. The monthly chart, on the other hand, presents a more significant support level at 16,800, which is essential to monitor for a potential trend reversal.
Furthermore, both the weekly and monthly charts share a common resistance level at 20,400. A move beyond this level, whether on a weekly or monthly closing basis, could lead to significant breakouts in the market, potentially targeting the 21,800 mark.
Conclusion
In the dynamic world of stock markets, technical analysis remains a valuable tool for traders and investors. Analyzing the Nifty 50 through weekly and monthly charts reveals important patterns and signals. While the rising wedge and bearish divergence on the weekly chart suggest a potential correction if confirmed with a close below 19,200 points, the monthly chart’s higher highs and bearish divergence call for caution, with a close below 16,800 needed for confirmation.
Traders and investors should keep a close eye on these support and resistance levels, as a move beyond 20,400 on either chart could indicate significant market developments. In this environment, it’s crucial to remain vigilant, adaptable, and well-informed to make informed trading decisions in the Nifty 50.