Nifty Future Technical Analysis: Chart Patterns and Key Levels for Short-Term Traders
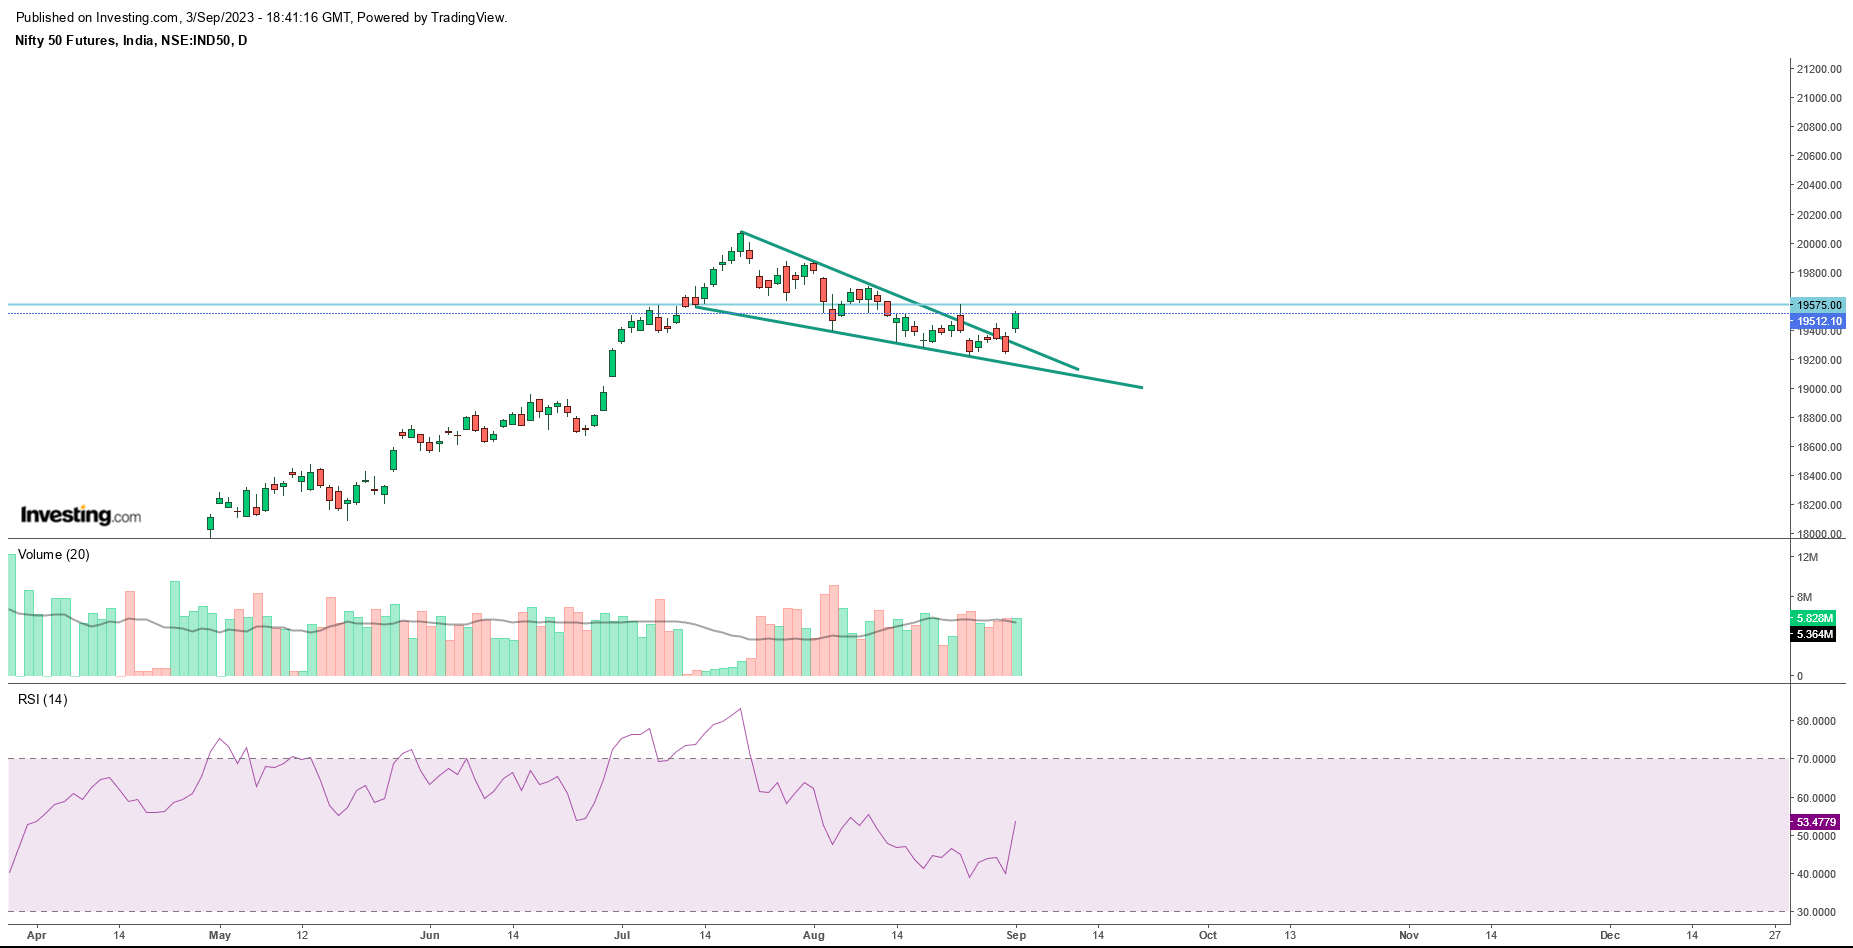
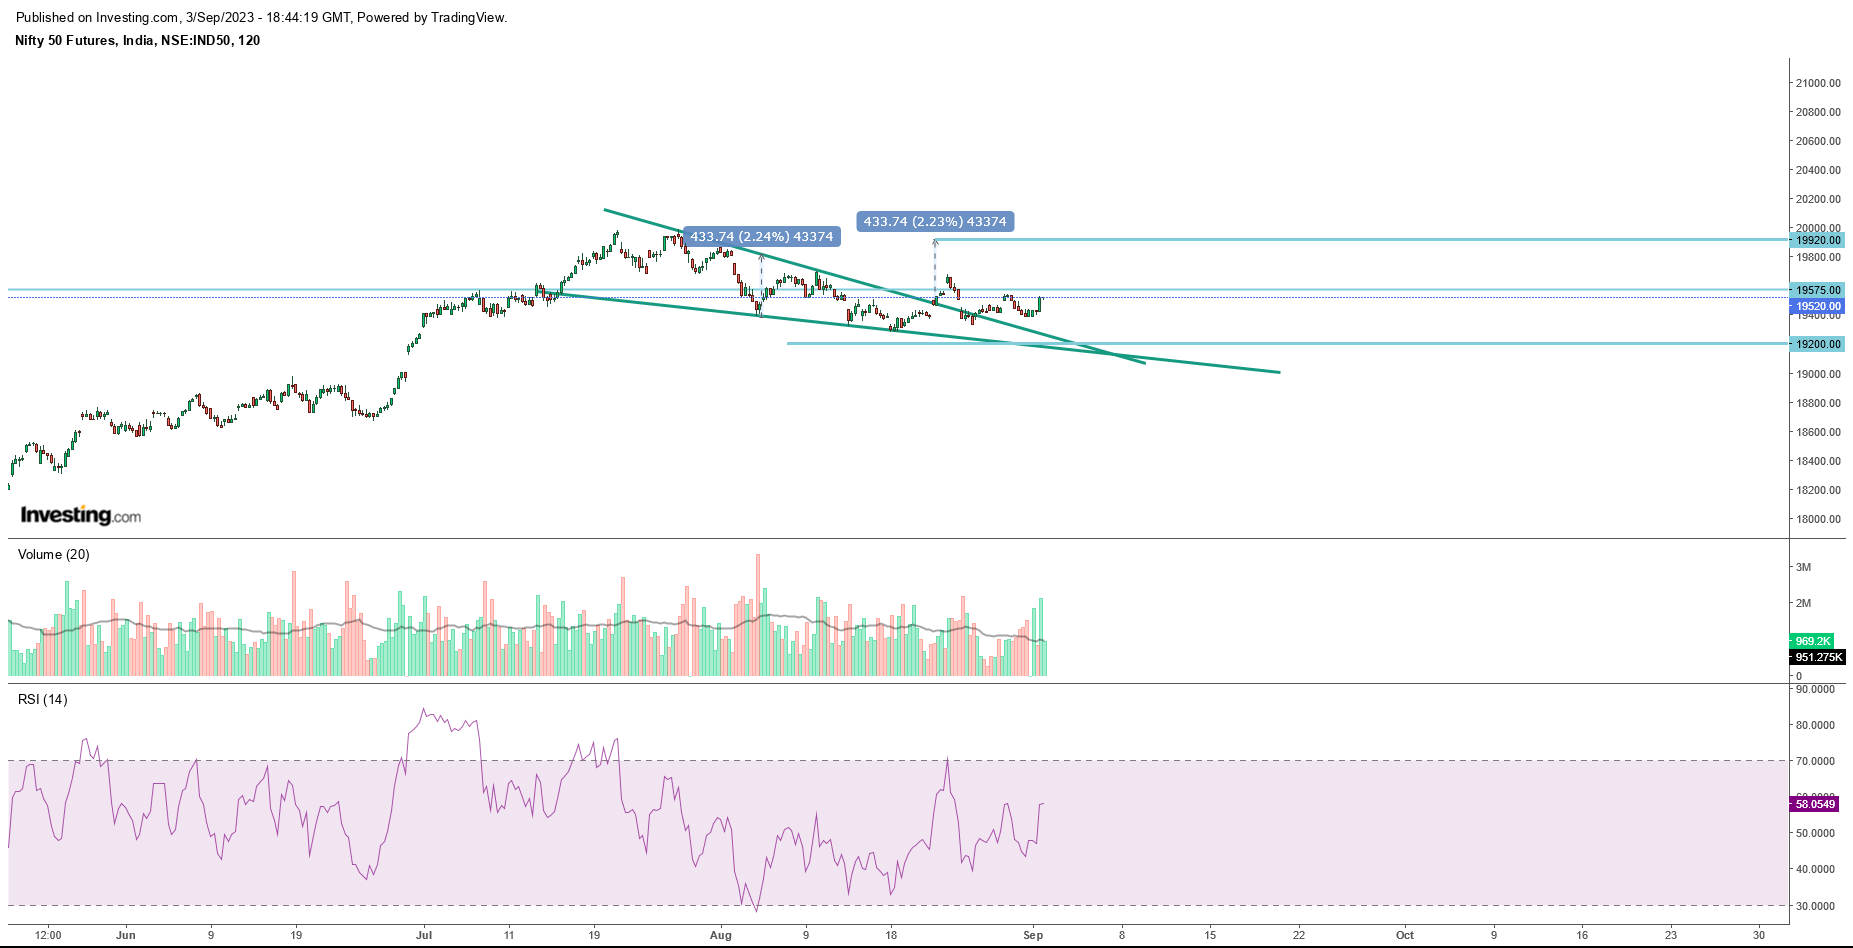
In recent weeks, the Nifty futures chart has displayed a compelling pattern – the falling wedge. This pattern, often viewed as a bullish indicator, appeared to be taking shape until just last week when a significant breakout occurred at the 19,430 level. The market surged further, reaching a high of 19,528.95. As we examine both daily and 2-hour charts, as well as the weekly chart, it becomes evident that the 19,575 level holds immense importance at this juncture.
Breakout and Confirmation
The breakout above 19,430 was certainly promising, and it’s an indication that bulls are regaining control. However, for traders to have confidence in this upward momentum, it is imperative that the Nifty closes above 19,575 and continues to trade convincingly above this level. This confirmation would serve as a powerful signal for short-term traders, potentially opening the doors to further gains, with a target in the vicinity of 19,920 and beyond.
The Critical Crossroads
Conversely, if the Nifty struggles to surpass and sustain above 19,575, it could signal the presence of strong resistance. In this scenario, it’s vital to monitor the downside, particularly the 19,200 level. A close below 19,200 could indicate a shift in sentiment, possibly leading the market into a short-term sell mode.
The Current Trading Range
For the time being, it’s safe to characterize the Nifty futures market as being within a trading range, with boundaries roughly defined by 19,200 and 19,600. Traders should be vigilant in assessing how the price action evolves within this range, as it could provide valuable insights into the market’s next directional move.
Risk Management and Strategy
In this dynamic trading environment, risk management should remain a top priority. Setting stop-loss orders, adhering to position sizing rules, and having a well-defined trading plan are all essential components of a successful short-term trading strategy. Additionally, keeping a close eye on economic events and market news that may influence Nifty futures is crucial.
Conclusion
In conclusion, the Nifty futures chart has recently broken out of a falling wedge pattern, providing a glimpse of bullish potential. However, the critical level to watch is 19,575. A confirmed close above this level could trigger further upside momentum, with targets around 19,920. Conversely, a failure to breach 19,575 and a close below 19,200 may signal a shift in the market sentiment.
As traders navigate this trading range, it’s essential to stay disciplined, adapt to changing conditions, and remain vigilant for key technical signals. Successful short-term trading in the Nifty futures market requires a combination of technical analysis, risk management, and a deep understanding of market dynamics.