Dw jones Daily chart
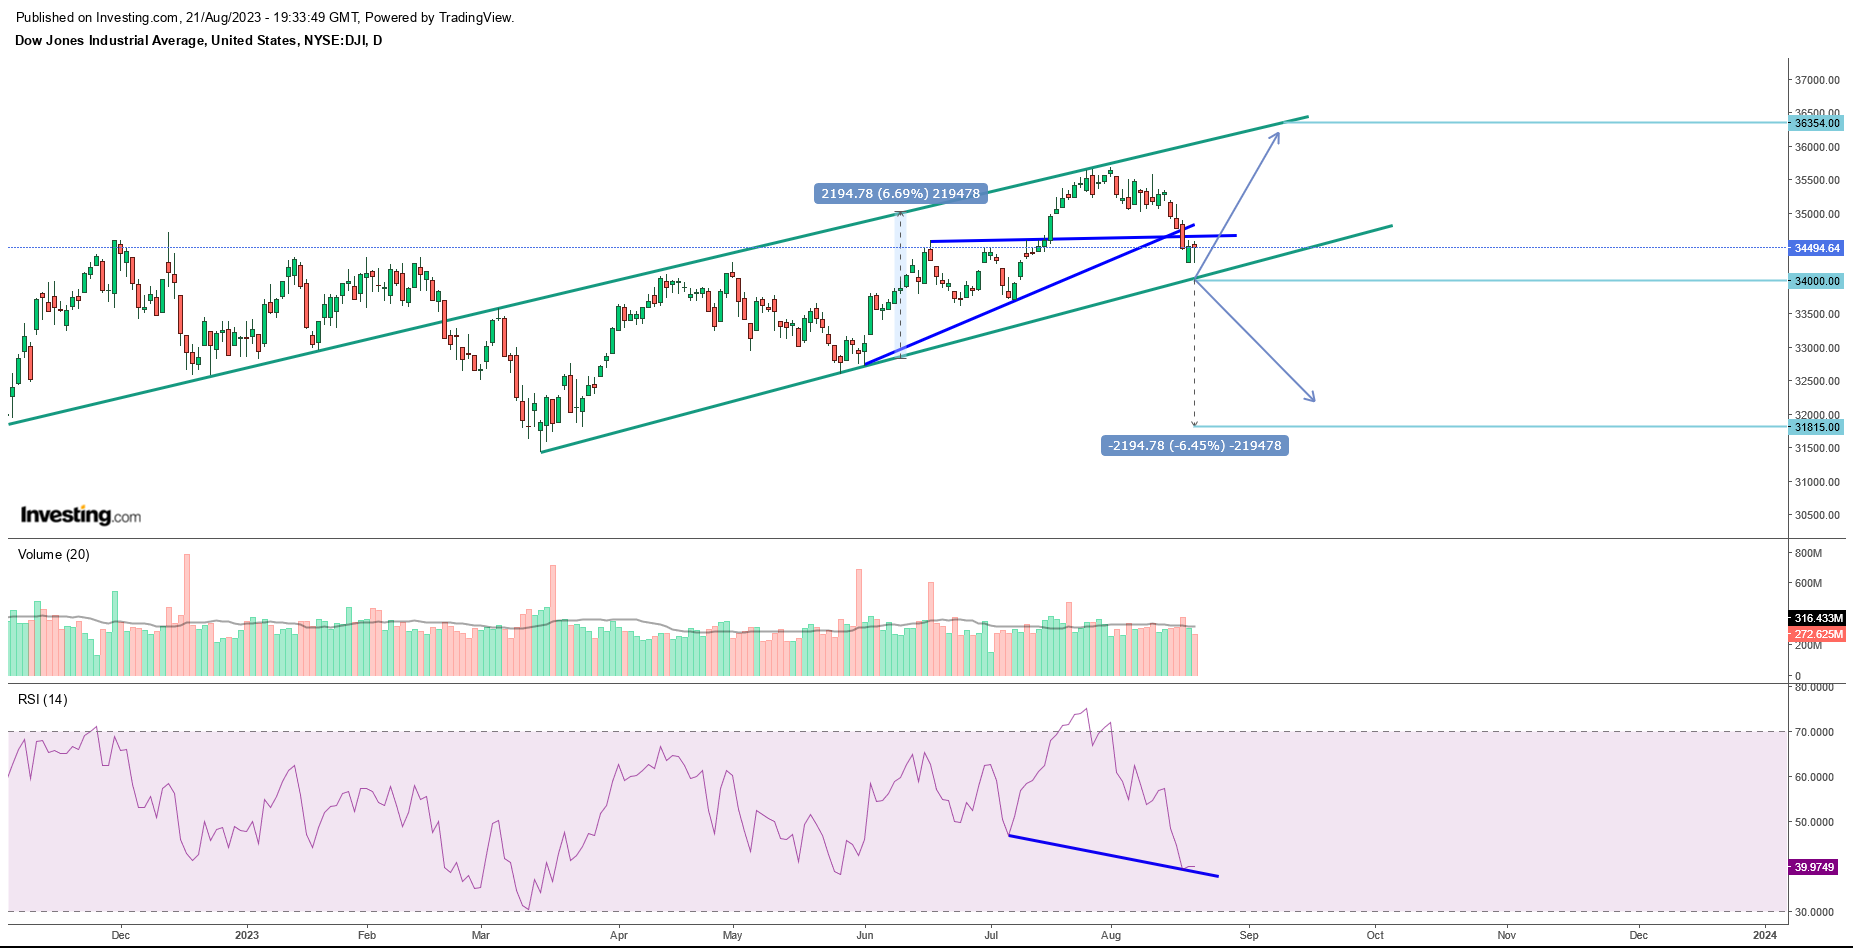
In the realm of technical analysis, the Dow Jones Index has recently exhibited intriguing patterns that offer insights into its potential future movements. A meticulous examination of the daily chart reveals a prevailing trend: the index is currently operating within a rising channel. Despite this, it’s notable that the Dow Jones has faced challenges in surpassing the midpoint of this channel. While the index continues to fashion higher bottoms and higher tops, a noteworthy development has transpired in the realm of Relative Strength Index (RSI) – the indicator has recently breached its higher bottom.
This pivotal occurrence lends credence to a multifaceted analysis. Should the Dow Jones fail to breach the recent bottom of 33,705.68, a distinct probability of an upswing emerges, potentially materializing around the support level of 34,000. This consequential maneuver would yield a bullish positive divergence on the chart, casting a favorable light on the index’s potential trajectory. Such an upsurge could conceivably propel the index toward the upper echelons of the channel, culminating around the resistance level of 36,354.
Conversely, the scenario hinges on the critical juncture of the Dow Jones staying true to its current trajectory. Should the index falter beneath the 34,000 support level, a pronounced correction is conceivable, taking into account the secondary crutch of 33,705.68. In the unfortunate event that this secondary level capitulates as well, the ramifications could be far-reaching, reinvigorating a major bearish trend and steering the Dow Jones toward a potential nadir of 31,815.
Several key inflection points merit attention in this analytical narrative. Notably, the 34,000 and 33,705.68 marks constitute formidable support zones. Crossing beneath the midpoint of 34,600 ushers the index into a precarious phase, casting a shadow of vulnerability on its trajectory. Should the Dow Jones overcome these hurdles, surging past 34,600, a journey toward 36,354 could very well be in the offing. However, should the 34,000 support crumble, a paradigm shift towards a sell trajectory is imminent, albeit with some semblance of stabilization anticipated around 33,705.68. The breakage of this secondary support, though, would augur a potential descent to 31,815.
With the Dow Jones currently hovering at 34,505, it navigates a neutrality, refraining from tilting decisively in any direction. The inflection points of breakout and breakdown become paramount in gauging the index’s next movements. The threshold of 34,600 looms as a pivotal level to breach, bearing the potential to propel the Dow Jones toward the upper echelons of 36,354. Conversely, should the 34,000 support falter, a retracement toward 31,815 might be in the cards.
In this intricate dance of technical analysis, the Dow Jones Index grapples with its own trajectory, revealing tantalizing prospects for both bullish resurgence and bearish correction. The fluid interplay between price dynamics and critical support levels manifests a narrative that only time will truly unfold.
In summation, the current technical landscape of the Dow Jones Index presents a complex tableau, teeming with potential outcomes. The index’s trajectory within a rising channel, coupled with the intricate interplay of higher bottoms, higher tops, and RSI movements, reflects the delicate balance between bullish resurgence and bearish correction. The pivotal support zones of 34,000 and 33,705.68 hold sway as the index contemplates its next steps. A breakthrough above the midpoint of 34,600 could herald a triumphant march towards 36,354, while a descent beneath 34,000 may usher in a retracement towards 31,815. As the Dow Jones treads cautiously at 34,505, its ultimate course remains a tapestry woven by the subtle nuances of technical analysis, echoing the ever-shifting dynamics of the market.