ULTIMATE BOTTOM LINE FOR MARKET IS – NEVER DECIDE THE TIME AND DIRECTION OF MARKET, BUT PROPER JUDGEMENT IS VERY IMPORTANT, WORKING WITH LEVELS ALWAYS GIVEN US A CLEAR VIEW ABOUT MARKET DIRECTIONS, BUT WRONG DECISION CAN ALWAYS LEAD YOU TO SUFFER FROM HEAVY LOSSES – AND WE STUDY MARKET AND LEVELS TO REDUCE THIS LOSSES AND TO STAY IN GOOD PROFITS
Last week due to some reason we not able to put our study in front of all of you, but last to last week we clearly mention that, nifty has given reversal signal from 5750 range with the pattern of “BULLISH HARAMI” “HAMMER” AND “ISLAND CLUSTER REVERSAL” and we also mention that nifty is forming “ASCENDING TRIANGLE” pattern on chart which can show us upper level till 6150-6250 range, and see as per our expectation nifty able to made level above 6200 with 6201.5 as a top, and if you go through all our weekly articles then you can see that we were bullish on market from 5400-5500 range only, and from there we inform about range of 6200-6400, and its enter into that range now.
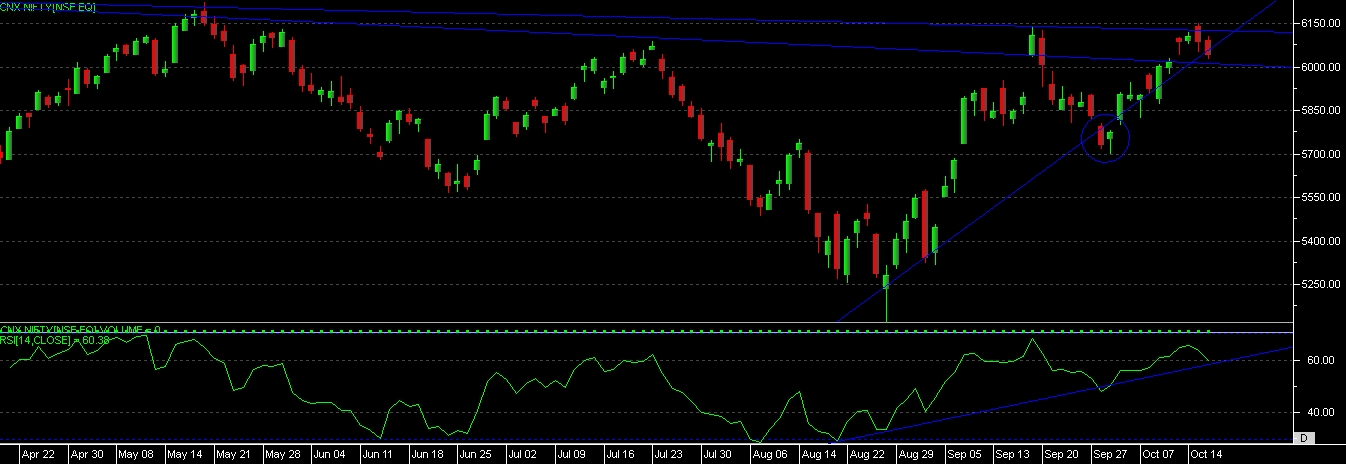
As per the current chart development of nifty we can see that nifty is moving upside with trend line support, even last time we inform that nifty is creating a “ASCENDING TRIANGLE” chart pattern, in a range of 6150-6250 {as it has given a same range tops 5 times on chart}.
As per the rsi development we can see that, rsi just touched the overbought zone now, price able to move above previous top, but rsi not yet moved, so it’s a case of “CONVERGENCE” on chart, but further price action will give us a clearer picture.
As per the candlestick patterns it has given a “BULLISH BELT HOLD” candle but at top level, so nothing more we can assume at this level now.
As per the technical chart we can see resistance at 6250 level, moving above this can give next breakout in a market for the target of 6400-6700 levels.
Down side we can consider support at 5970 level, as this a gap support as well as trend line support also.
So if market stays range bound then we can expect movement in a range of 5970-6250 levels, and moving beyond this range and giving close for 2 session beyond this levels will give a next direction to the market.