buy ASAHISONG above 96 {closing basis} sl 75 target 125-147
technical chart study
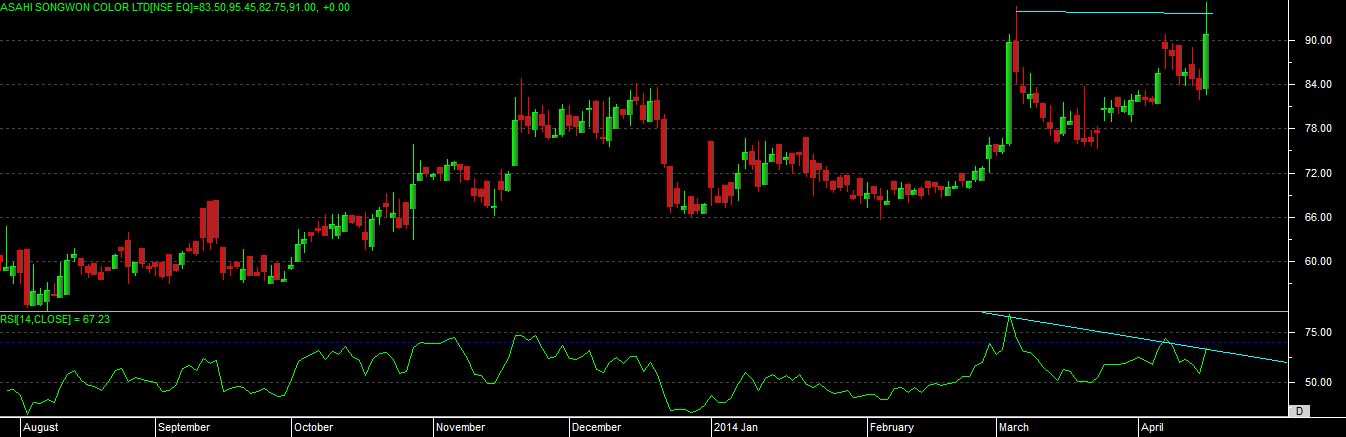
as per technical chart we can see that after a recent fall, stock able to give pull back till the recent high level, so we can even consider it as a double top.
in last session we seen some good bullish candle on chart, so this can indicate us that, there is a position buildup and stock can show momentum in coming days, if able to close and sustain above current high level.
on chart we can even see that stock has taken a good bounce after touching the support line, and as per pattern it has made ” RISING WEDGE” pattern on chart now.
even rsi is showing a “BULLISH NEGATIVE DIVERGENCE” on chart, if price able to give close above 96 level.
as rsi still having a scope to move into overbought region so, this can bring the price action.
so basic indication is if price able to close above mention level, then buy and hold this stock with mention level as support and as per patterns identified on chart, according to that price can try to hit the mention levels upside.