buy MCNALLY BHARAT above 76 sl 60 target 120-150
technical chart study
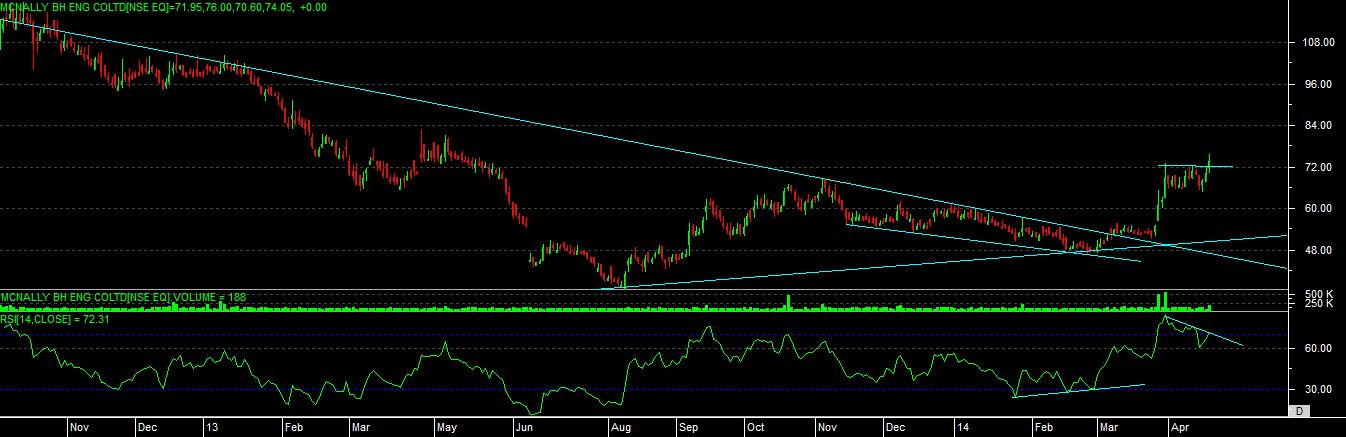
as per chart we can see that recently stock able to change its falling trend, as it able to move above long term resistance level.
even at bottom it has given a “POSITIVE DIVERGENCE” signal.
now at upper level it has almost made “FLAG” pattern and can do movement with respect to pole high after breakout.
again at upper level it has made “BULLISH NEGATIVE DIVERGENCE” so we can expect a good move if stock able to close and move above our mention level.